Estimated Value: $122,000 - $168,000
3
Beds
1
Bath
988
Sq Ft
$142/Sq Ft
Est. Value
About This Home
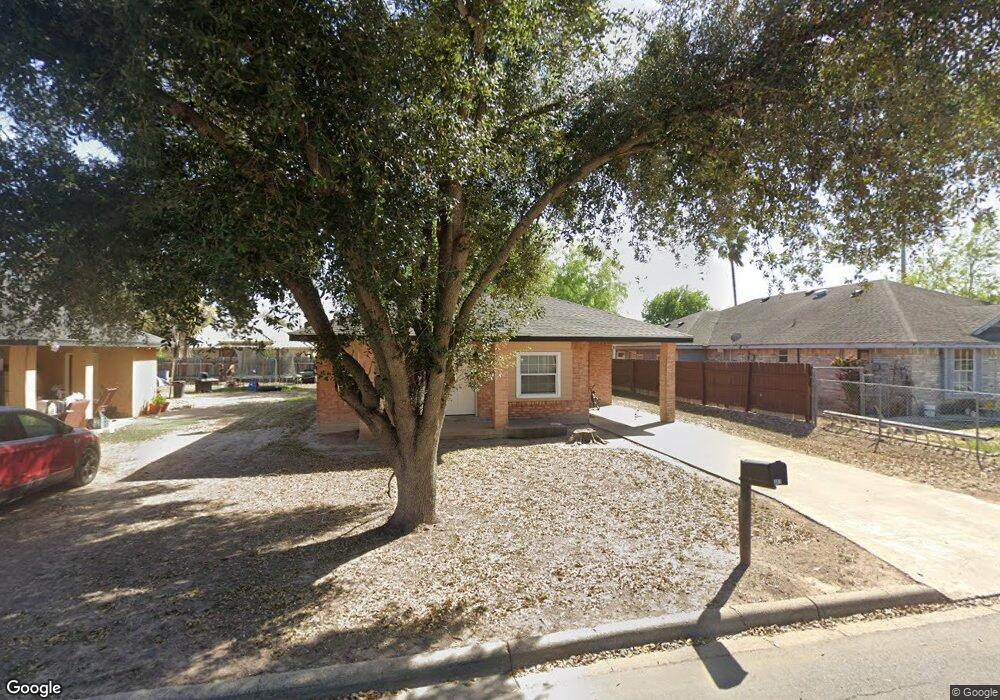
This home is located at 302 E Del Norte Cir, Pharr, TX 78577 and is currently estimated at $140,702, approximately $142 per square foot. 302 E Del Norte Cir is a home located in Hidalgo County with nearby schools including Henry Ford Elementary, Liberty Middle School, and PSJA North Early College High School.
Create a Home Valuation Report for This Property
The Home Valuation Report is an in-depth analysis detailing your home's value as well as a comparison with similar homes in the area
Home Values in the Area
Average Home Value in this Area
Tax History Compared to Growth
Tax History
| Year | Tax Paid | Tax Assessment Tax Assessment Total Assessment is a certain percentage of the fair market value that is determined by local assessors to be the total taxable value of land and additions on the property. | Land | Improvement |
|---|---|---|---|---|
| 2025 | $2,942 | $134,649 | $48,823 | $85,826 |
| 2024 | $2,942 | $109,688 | $39,059 | $70,629 |
| 2023 | $2,967 | $110,682 | $39,059 | $71,623 |
| 2022 | $2,511 | $89,513 | $24,134 | $65,379 |
| 2021 | $2,252 | $78,844 | $24,134 | $54,710 |
| 2020 | $2,175 | $75,180 | $24,134 | $51,046 |
| 2019 | $1,721 | $58,734 | $16,195 | $42,539 |
| 2018 | $1,723 | $58,454 | $14,607 | $43,847 |
| 2017 | $1,776 | $59,763 | $14,607 | $45,156 |
| 2016 | $1,665 | $56,011 | $14,607 | $41,404 |
| 2015 | $1,594 | $56,594 | $14,607 | $41,987 |
Source: Public Records
Map
Nearby Homes
- 304 & 306 E Polk Ave
- 417 E Chapa Ave
- 118 E Emil St
- 813 E Villegas Ave
- 204 W Eller Ave
- 901 N Huisache St
- 903 E San Antonio Ave
- 513 E Hawk Ave
- 214 E Clark Ave
- 205 E Lee St
- 1013 E San Antonio Ave
- 309 E Hawk Ave
- 117 W Hawk Ave
- 719 N Canna St
- 921 E Alan St
- 1102 E Eller Ave
- 313 W Eller Ave
- 114 W Clark Ave
- 808 E Evans Ave
- 00 E Ferguson Ave
- 304 E Del Norte Cir
- 300 E Del Norte Cir
- 300 E Del Norte Cir
- 303 E Cypress St
- 306 E Del Norte Cir
- 305 E Cypress St
- 301 E Del Norte Cir
- 303 E Del Norte Cir
- 307 E Cypress St
- 305 E Del Norte Cir
- 308 E Del Norte Cir
- 807 N Tierra Dr
- 307 E Del Norte Cir
- 805 N Tierra Dr
- 816 N Tierra Dr
- 309 E Cypress St
- 809 N Tierra Dr
- 803 N Tierra Dr
- 801 N Tierra Dr
- 811 N Tierra Dr