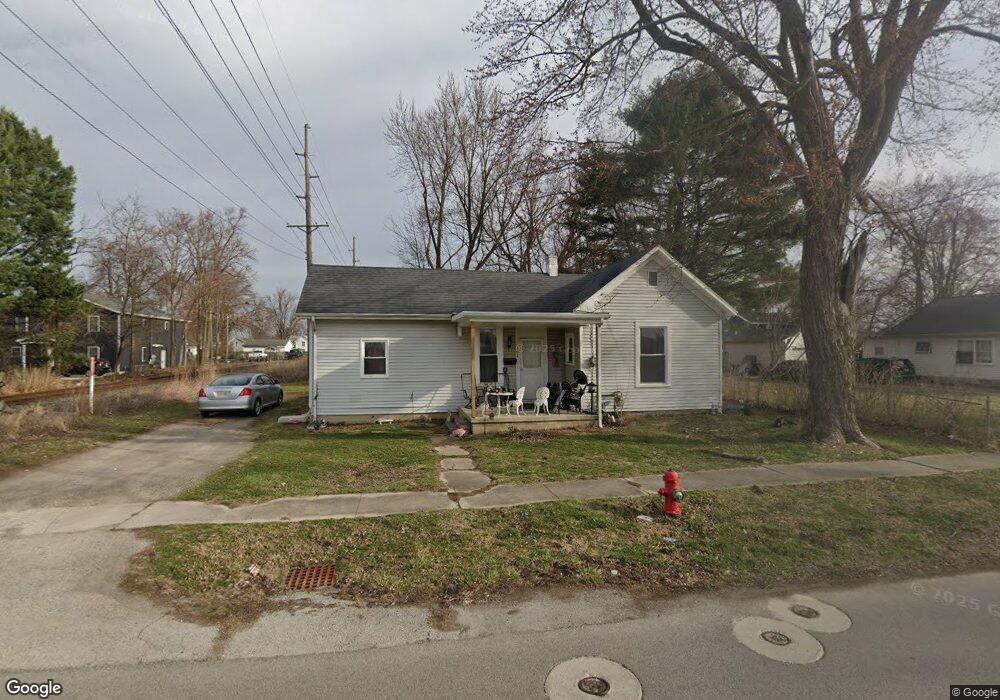
302 George St Findlay, OH 45840
Estimated Value: $105,000 - $159,000
2
Beds
1
Bath
971
Sq Ft
$138/Sq Ft
Est. Value
About This Home
This home is located at 302 George St, Findlay, OH 45840 and is currently estimated at $134,442, approximately $138 per square foot. 302 George St is a home located in Hancock County with nearby schools including Whittier Primary School, Bigelow Hill Elementary School, and Glenwood Middle School.
Ownership History
Date
Name
Owned For
Owner Type
Purchase Details
Closed on
Feb 23, 2017
Sold by
Lenhart Jeffrey L
Bought by
Lenhart Jeffrey L
Current Estimated Value
Purchase Details
Closed on
Dec 10, 2001
Sold by
Fleming A Irene
Bought by
Lenhart Jeffrey L
Purchase Details
Closed on
Apr 19, 1993
Bought by
Fleming Rex H and Fleming Irene A
Purchase Details
Closed on
May 30, 1989
Bought by
Webb Denise E
Purchase Details
Closed on
Jan 21, 1982
Bought by
Elling Bruce M and Elling Kathy I
Create a Home Valuation Report for This Property
The Home Valuation Report is an in-depth analysis detailing your home's value as well as a comparison with similar homes in the area
Home Values in the Area
Average Home Value in this Area
Purchase History
| Date | Buyer | Sale Price | Title Company |
|---|---|---|---|
| Lenhart Jeffrey L | -- | None Available | |
| Lenhart Jeffrey L | $42,000 | -- | |
| Fleming Rex H | $39,000 | -- | |
| Webb Denise E | $30,000 | -- | |
| Elling Bruce M | $13,000 | -- |
Source: Public Records
Tax History Compared to Growth
Tax History
| Year | Tax Paid | Tax Assessment Tax Assessment Total Assessment is a certain percentage of the fair market value that is determined by local assessors to be the total taxable value of land and additions on the property. | Land | Improvement |
|---|---|---|---|---|
| 2024 | $1,003 | $27,510 | $4,710 | $22,800 |
| 2023 | $1,005 | $27,510 | $4,710 | $22,800 |
| 2022 | $1,001 | $27,510 | $4,710 | $22,800 |
| 2021 | $870 | $20,820 | $4,720 | $16,100 |
| 2020 | $870 | $20,820 | $4,720 | $16,100 |
| 2019 | $852 | $20,820 | $4,720 | $16,100 |
| 2018 | $768 | $17,220 | $4,290 | $12,930 |
| 2017 | $384 | $17,220 | $4,290 | $12,930 |
| 2016 | $771 | $17,220 | $4,290 | $12,930 |
| 2015 | $722 | $16,050 | $2,350 | $13,700 |
| 2014 | $722 | $16,050 | $2,350 | $13,700 |
| 2012 | $728 | $16,050 | $2,350 | $13,700 |
Source: Public Records
Map
Nearby Homes
- 230 Midland Ave
- 206 Midland Ave
- 115 George St
- 420 Allen Ave
- 334 E Foulke Ave
- 247 Crystal Ave
- 207 Ash Ave
- 715 Christina Ct
- 706 N Cory St
- 1825 Pershing St
- 1010 Brenda Ct
- 224 Defiance Ave
- 716 Winfield Ave
- 1820 N Main St
- 512 N Cory St
- 213 Cherry St
- 1062 Vincent St
- 1908 Gayle Ln
- 600 Charles Ave
- 1934 Geffs Ave
- 314 George St
- 307 Garfield Ave
- 240 George St
- 309 Garfield Ave
- 316 George St
- 234 George St
- 315 Garfield Ave
- 235 Garfield Ave
- 241 George St
- 318 George St
- 232 George St
- 317 Garfield Ave
- 302 Garfield Ave
- 320 George St
- 304 Garfield Ave
- 226 George St
- 312 Garfield Ave
- 308 Garfield Ave
- 221 Garfield Ave
- 238 Garfield Ave