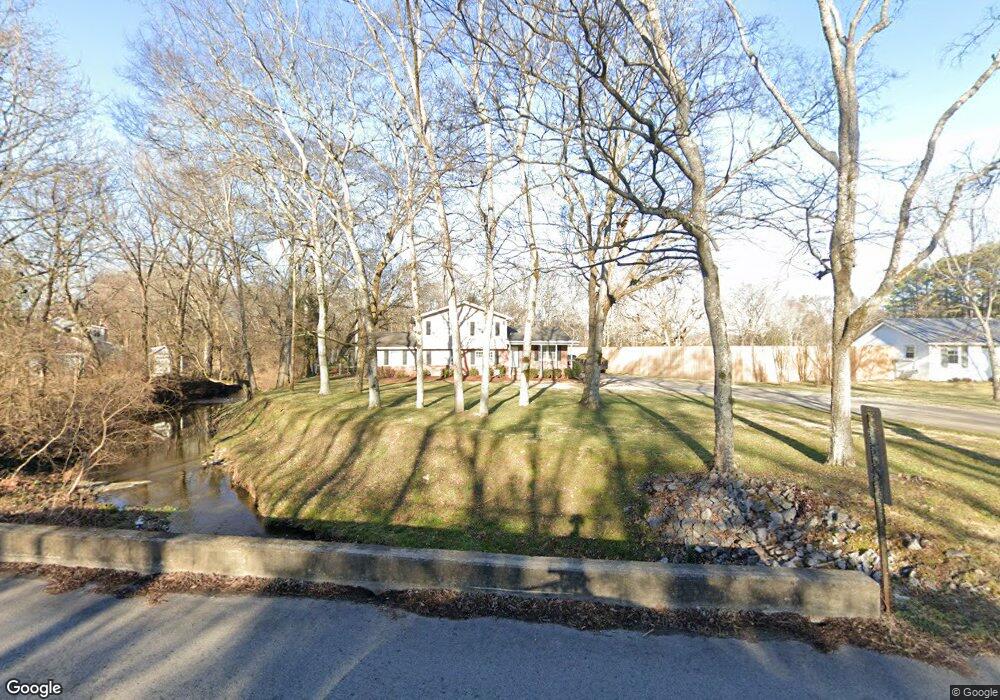
302 Harpeth Hills Dr Franklin, TN 37069
Estimated Value: $672,609 - $804,000
--
Bed
2
Baths
2,102
Sq Ft
$343/Sq Ft
Est. Value
About This Home
This home is located at 302 Harpeth Hills Dr, Franklin, TN 37069 and is currently estimated at $721,652, approximately $343 per square foot. 302 Harpeth Hills Dr is a home located in Williamson County with nearby schools including Grassland Elementary School, Grassland Middle School, and Franklin High School.
Ownership History
Date
Name
Owned For
Owner Type
Purchase Details
Closed on
Jun 6, 2007
Sold by
Stephens John Christopher and Stephens Joy Elizabeth
Bought by
Rowland Chad F and Rowland Crystal L
Current Estimated Value
Home Financials for this Owner
Home Financials are based on the most recent Mortgage that was taken out on this home.
Original Mortgage
$244,000
Outstanding Balance
$148,573
Interest Rate
6.1%
Mortgage Type
Purchase Money Mortgage
Estimated Equity
$573,079
Purchase Details
Closed on
Jul 19, 2001
Sold by
Tillman J Scott and Tillman Michelle W
Bought by
Stephens John Christopher and Stephens Joy Elizabeth
Home Financials for this Owner
Home Financials are based on the most recent Mortgage that was taken out on this home.
Original Mortgage
$168,100
Interest Rate
7.16%
Purchase Details
Closed on
Dec 13, 1996
Sold by
Beazley Kenneth D
Bought by
Tillman J Scott
Create a Home Valuation Report for This Property
The Home Valuation Report is an in-depth analysis detailing your home's value as well as a comparison with similar homes in the area
Home Values in the Area
Average Home Value in this Area
Purchase History
| Date | Buyer | Sale Price | Title Company |
|---|---|---|---|
| Rowland Chad F | $275,000 | Southland Title & Escrow Co | |
| Stephens John Christopher | $177,000 | Premier Title & Escrow Llc | |
| Tillman J Scott | $149,900 | -- |
Source: Public Records
Mortgage History
| Date | Status | Borrower | Loan Amount |
|---|---|---|---|
| Open | Rowland Chad F | $244,000 | |
| Previous Owner | Stephens John Christopher | $168,100 |
Source: Public Records
Tax History Compared to Growth
Tax History
| Year | Tax Paid | Tax Assessment Tax Assessment Total Assessment is a certain percentage of the fair market value that is determined by local assessors to be the total taxable value of land and additions on the property. | Land | Improvement |
|---|---|---|---|---|
| 2024 | $2,127 | $113,125 | $46,250 | $66,875 |
| 2023 | $2,127 | $113,125 | $46,250 | $66,875 |
| 2022 | $2,127 | $113,125 | $46,250 | $66,875 |
| 2021 | $2,127 | $113,125 | $46,250 | $66,875 |
| 2020 | $1,868 | $84,150 | $28,750 | $55,400 |
| 2019 | $1,759 | $79,250 | $28,750 | $50,500 |
| 2018 | $1,704 | $79,250 | $28,750 | $50,500 |
| 2017 | $1,704 | $79,250 | $28,750 | $50,500 |
| 2016 | $1,704 | $79,250 | $28,750 | $50,500 |
| 2015 | -- | $62,225 | $20,000 | $42,225 |
| 2014 | -- | $62,225 | $20,000 | $42,225 |
Source: Public Records
Map
Nearby Homes
- 202 Harpeth Hills Dr
- 316 Bobby Dr
- 0 Gen J B Hood Dr
- 1008 Lucas Ct
- 1235 Bradley Dr
- 1017 Boxwood Dr
- 134 Featherstone Dr
- 1969 Sunny Side Dr
- 402 Lake Valley Dr
- 2513 Hillsboro Rd
- 409 Lake Valley Dr
- 405 Lake Valley Dr
- 514 Legends Ridge Ct
- 2011 Sunny Side Dr
- 641 Legends Crest Dr
- 513 Legends Ridge Ct
- 645 Legends Crest Dr
- 2057 Hillsboro Rd
- 384 Lake Valley Dr
- 728 Legends Crest Dr
- 206 Harpeth Hills Dr
- 304 Harpeth Hills Dr
- 301 Harpeth Hills Dr
- 306 Harpeth Hills Dr
- 203 Harpeth Hills Dr
- 303 Harpeth Hills Dr
- 204 Harpeth Hills Dr
- 305 Harpeth Hills Dr
- 307 Harpeth Hills Dr
- 308 Harpeth Hills Dr
- 201 Harpeth Hills Dr
- 314 Bobby Dr
- 309 Harpeth Hills Dr
- 312 Bobby Dr
- 310 Harpeth Hills Dr
- 213 Overlook Dr
- 203 Manley Ct
- 311 Harpeth Hills Dr
- 205 Manley Ct
- 312 Harpeth Hills Dr