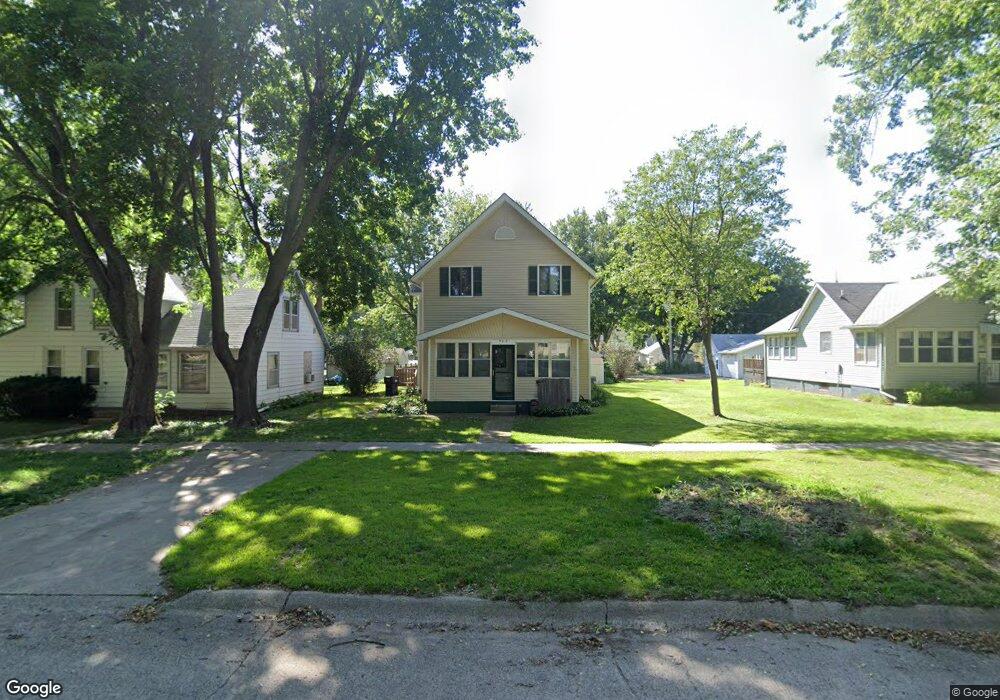
302 N Maple St Marcus, IA 51035
Estimated Value: $119,000 - $129,000
3
Beds
2
Baths
1,514
Sq Ft
$83/Sq Ft
Est. Value
About This Home
This home is located at 302 N Maple St, Marcus, IA 51035 and is currently estimated at $126,100, approximately $83 per square foot. 302 N Maple St is a home located in Cherokee County with nearby schools including MMCRU Marcus Elementary School and MMCRU High School.
Ownership History
Date
Name
Owned For
Owner Type
Purchase Details
Closed on
Jul 20, 2017
Sold by
Jackson Jerry
Bought by
Jackson Melony
Current Estimated Value
Purchase Details
Closed on
Oct 20, 2006
Sold by
Gauger Phillip
Bought by
Bentz Melony K and Gryp Joan M
Home Financials for this Owner
Home Financials are based on the most recent Mortgage that was taken out on this home.
Original Mortgage
$34,510
Outstanding Balance
$20,638
Interest Rate
6.5%
Mortgage Type
FHA
Estimated Equity
$105,462
Create a Home Valuation Report for This Property
The Home Valuation Report is an in-depth analysis detailing your home's value as well as a comparison with similar homes in the area
Purchase History
| Date | Buyer | Sale Price | Title Company |
|---|---|---|---|
| Jackson Melony | -- | None Available | |
| Bentz Melony K | $60,000 | None Available |
Source: Public Records
Mortgage History
| Date | Status | Borrower | Loan Amount |
|---|---|---|---|
| Open | Bentz Melony K | $34,510 |
Source: Public Records
Tax History
| Year | Tax Paid | Tax Assessment Tax Assessment Total Assessment is a certain percentage of the fair market value that is determined by local assessors to be the total taxable value of land and additions on the property. | Land | Improvement |
|---|---|---|---|---|
| 2025 | $1,190 | $90,880 | $8,820 | $82,060 |
| 2024 | $1,190 | $84,480 | $8,820 | $75,660 |
| 2023 | $1,164 | $84,480 | $8,820 | $75,660 |
| 2022 | $1,036 | $62,630 | $8,820 | $53,810 |
| 2021 | $1,036 | $62,630 | $8,820 | $53,810 |
| 2020 | $1,006 | $62,630 | $8,820 | $53,810 |
| 2019 | $1,030 | $62,630 | $0 | $0 |
| 2018 | $1,130 | $68,862 | $0 | $0 |
| 2017 | $1,150 | $68,862 | $0 | $0 |
| 2016 | $1,184 | $68,862 | $0 | $0 |
| 2015 | $1,078 | $58,856 | $0 | $0 |
| 2014 | $1,078 | $58,856 | $0 | $0 |
Source: Public Records
Map
Nearby Homes
- 304 N Maple St
- 304 N Maple St
- 300 N Maple St
- 310 N Maple St
- 310 N Maple St Unit St
- 301 N Walnut St
- 303 N Walnut St
- 210 W Pine St
- 303 N Maple St
- 305 N Maple St
- 307 N Maple St
- 305 N Walnut St
- 309 N Maple St
- 209 W Pine St
- 206 N Maple St
- 311 N Maple St
- 311 N Maple St Unit St
- 108 W Pine St
- 308 N Main St
- 209 N Maple St
Your Personal Tour Guide
Ask me questions while you tour the home.