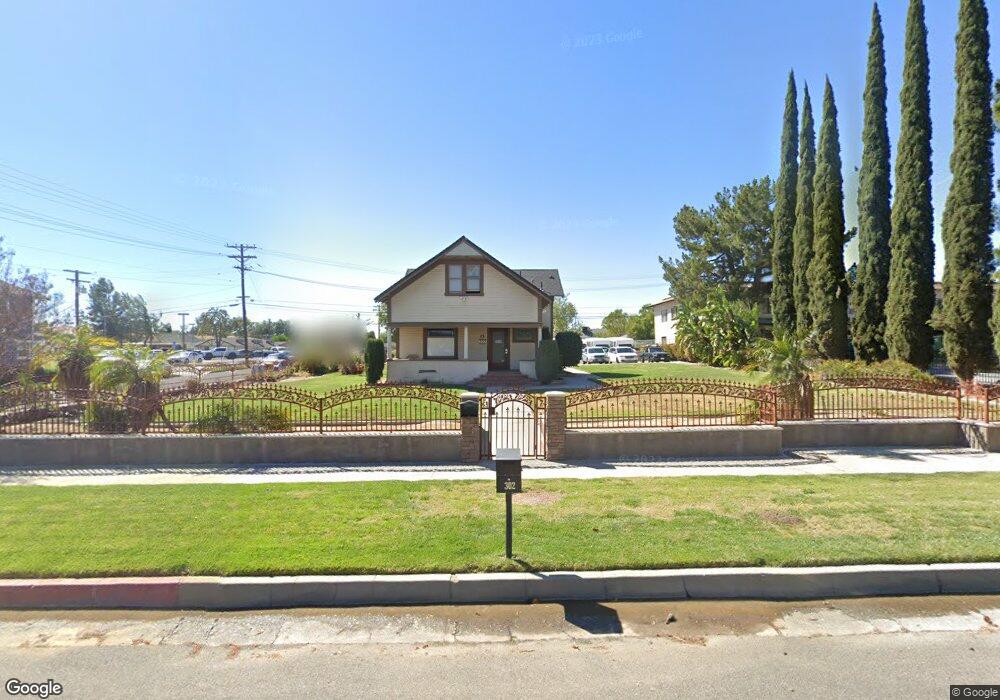
302 N Riverside Ave Rialto, CA 92376
Estimated Value: $729,000 - $1,081,715
3
Beds
1
Bath
1,862
Sq Ft
$486/Sq Ft
Est. Value
About This Home
This home is located at 302 N Riverside Ave, Rialto, CA 92376 and is currently estimated at $905,358, approximately $486 per square foot. 302 N Riverside Ave is a home located in San Bernardino County with nearby schools including Charlotte N. Werner Elementary School, Rialto Middle School, and Eisenhower High School.
Ownership History
Date
Name
Owned For
Owner Type
Purchase Details
Closed on
Apr 17, 2018
Sold by
Palmer Edward M
Bought by
Sanzo William J and Sanzo Marilyn
Current Estimated Value
Home Financials for this Owner
Home Financials are based on the most recent Mortgage that was taken out on this home.
Original Mortgage
$578,000
Outstanding Balance
$497,070
Interest Rate
4.44%
Mortgage Type
Seller Take Back
Estimated Equity
$408,288
Purchase Details
Closed on
Jan 10, 2003
Sold by
Palmer Kimberly A
Bought by
Palmer Edward M
Purchase Details
Closed on
Oct 4, 1999
Sold by
Gulf Coast Bank & Trust
Bought by
Palmer Edward M and Palmer Kimberly A
Home Financials for this Owner
Home Financials are based on the most recent Mortgage that was taken out on this home.
Original Mortgage
$87,000
Interest Rate
7.82%
Mortgage Type
Seller Take Back
Purchase Details
Closed on
Apr 30, 1999
Sold by
Chittivelu Seshaiah Tr
Bought by
Gulf Coast Bank & Trust
Create a Home Valuation Report for This Property
The Home Valuation Report is an in-depth analysis detailing your home's value as well as a comparison with similar homes in the area
Home Values in the Area
Average Home Value in this Area
Purchase History
| Date | Buyer | Sale Price | Title Company |
|---|---|---|---|
| Sanzo William J | $640,000 | Fidelity National Title Comp | |
| Palmer Edward M | -- | Chicago Title Co | |
| Palmer Edward M | $122,000 | Fidelity National Title Co | |
| Gulf Coast Bank & Trust | $74,275 | -- |
Source: Public Records
Mortgage History
| Date | Status | Borrower | Loan Amount |
|---|---|---|---|
| Open | Sanzo William J | $578,000 | |
| Previous Owner | Palmer Edward M | $87,000 |
Source: Public Records
Tax History Compared to Growth
Tax History
| Year | Tax Paid | Tax Assessment Tax Assessment Total Assessment is a certain percentage of the fair market value that is determined by local assessors to be the total taxable value of land and additions on the property. | Land | Improvement |
|---|---|---|---|---|
| 2025 | $9,100 | $728,212 | $341,349 | $386,863 |
| 2024 | $9,100 | $713,933 | $334,656 | $379,277 |
| 2023 | $9,685 | $699,934 | $328,094 | $371,840 |
| 2022 | $8,979 | $686,210 | $321,661 | $364,549 |
| 2021 | $8,923 | $672,755 | $315,354 | $357,401 |
| 2020 | $8,970 | $665,856 | $312,120 | $353,736 |
| 2019 | $8,772 | $652,800 | $306,000 | $346,800 |
| 2018 | $2,465 | $164,800 | $121,573 | $43,227 |
| 2017 | $2,111 | $161,568 | $119,189 | $42,379 |
| 2016 | $2,087 | $158,400 | $116,852 | $41,548 |
| 2015 | $2,096 | $156,021 | $115,097 | $40,924 |
| 2014 | $1,972 | $152,964 | $112,842 | $40,122 |
Source: Public Records
Map
Nearby Homes
- 228 N Orange Ave
- 210 N Riverside Ave
- 190 W 3rd St
- 139 N Palm Ave
- 117 N Orange Ave
- 201 N Magnolia Ave
- 236 W 1st St
- 342 N Clifford Ave
- 350 N Clifford Ave
- 251 E Ramona Dr
- 530 N Sycamore Ave
- 432 N Sage Ave
- 352 Alice Ave
- 459 W Ramona Dr
- 332 E Rosewood St
- 365 Huntington Ct
- 531 W Ramona Dr
- 350 N Park Ave
- 530 E 3rd St
- 109 S Joyce Ave
- 308 N Riverside Ave
- 290 N Riverside Ave
- 301 N Orange Ave
- 303 N Orange Ave
- 313 N Orange Ave
- 317 N Orange Ave
- 320 N Riverside Ave
- 325 N Orange Ave
- 230 N Riverside Ave
- 327 N Orange Ave
- 301 N Riverside Ave
- 311 N Riverside Ave
- 245 N Riverside Ave
- 317 N Riverside Ave
- 244 N Orange Ave
- 306 N Orange Ave
- 300 N Orange Ave
- 312 N Orange Ave
- 325 N Riverside Ave
- 239 N Riverside Ave