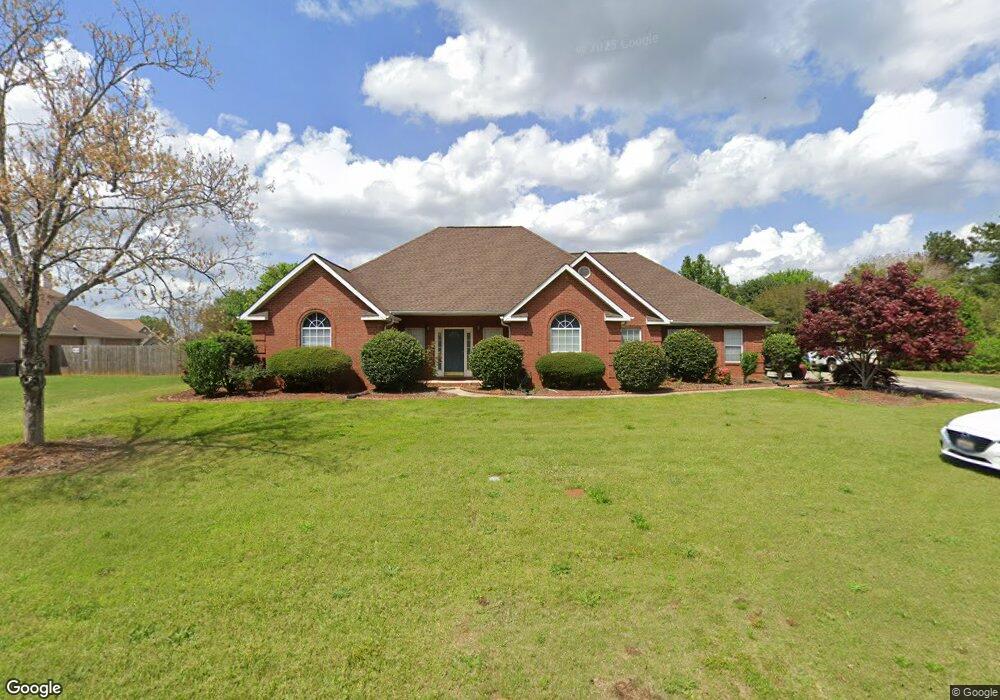
302 Red Bird Cir Bonaire, GA 31005
Estimated Value: $333,946 - $351,000
4
Beds
2
Baths
2,452
Sq Ft
$139/Sq Ft
Est. Value
About This Home
This home is located at 302 Red Bird Cir, Bonaire, GA 31005 and is currently estimated at $341,987, approximately $139 per square foot. 302 Red Bird Cir is a home located in Houston County with nearby schools including Hilltop Elementary School, Bonaire Middle School, and Veterans High School.
Ownership History
Date
Name
Owned For
Owner Type
Purchase Details
Closed on
Apr 28, 2010
Sold by
Justin Chris and Justin Karen J
Bought by
Orellana Rigoberto P
Current Estimated Value
Home Financials for this Owner
Home Financials are based on the most recent Mortgage that was taken out on this home.
Original Mortgage
$152,800
Outstanding Balance
$101,862
Interest Rate
4.94%
Mortgage Type
New Conventional
Estimated Equity
$240,125
Purchase Details
Closed on
Nov 5, 2004
Sold by
Zobel Robert L
Bought by
Justin Chris and Justin Karen J
Purchase Details
Closed on
Jun 2, 2002
Sold by
Zobel Robert L and Zobel Sandra A
Bought by
Zobel Robert L
Purchase Details
Closed on
Jun 14, 1996
Sold by
Nolan Construction Inc
Bought by
Zobel Robert L and Zobel Sandra A
Purchase Details
Closed on
Dec 11, 1995
Sold by
Bowles Naomi Kersey Etal
Bought by
Noles Steven J and Hammett Bobby L
Create a Home Valuation Report for This Property
The Home Valuation Report is an in-depth analysis detailing your home's value as well as a comparison with similar homes in the area
Home Values in the Area
Average Home Value in this Area
Purchase History
| Date | Buyer | Sale Price | Title Company |
|---|---|---|---|
| Orellana Rigoberto P | $191,000 | None Available | |
| Justin Chris | $187,900 | -- | |
| Zobel Robert L | -- | -- | |
| Zobel Robert L | $152,900 | -- | |
| Nolan Construction Inc | -- | -- | |
| Noles Steven J | $16,200 | -- |
Source: Public Records
Mortgage History
| Date | Status | Borrower | Loan Amount |
|---|---|---|---|
| Open | Orellana Rigoberto P | $152,800 |
Source: Public Records
Tax History Compared to Growth
Tax History
| Year | Tax Paid | Tax Assessment Tax Assessment Total Assessment is a certain percentage of the fair market value that is determined by local assessors to be the total taxable value of land and additions on the property. | Land | Improvement |
|---|---|---|---|---|
| 2024 | $2,840 | $120,720 | $12,000 | $108,720 |
| 2023 | $2,601 | $109,600 | $12,000 | $97,600 |
| 2022 | $2,254 | $95,240 | $12,000 | $83,240 |
| 2021 | $1,963 | $82,800 | $10,000 | $72,800 |
| 2020 | $1,864 | $76,160 | $10,000 | $66,160 |
| 2019 | $1,810 | $76,160 | $10,000 | $66,160 |
| 2018 | $1,810 | $76,160 | $10,000 | $66,160 |
| 2017 | $1,861 | $76,160 | $10,000 | $66,160 |
| 2016 | $1,864 | $76,160 | $10,000 | $66,160 |
| 2015 | $1,867 | $76,160 | $10,000 | $66,160 |
| 2014 | -- | $76,160 | $10,000 | $66,160 |
| 2013 | -- | $75,240 | $10,000 | $65,240 |
Source: Public Records
Map
Nearby Homes
- 214 Meadows Ln
- 212 Meadows Ln
- 212 Meadows Ln Unit 225
- 113 Galaxy Ave
- 308 Peach Blossom Rd
- 304 Jubilee Cir
- 111 Willowgate Dr
- 103 Grindstaff Dr
- 211 Crakston Ct
- 303 Gray Fox Crossing
- 121 Chadwyck Cir
- 203 Lattice Bend
- 413 Cannon Point Dr
- 416 Cannon Point Dr
- Cypress Plan at Knob Hill
- Camden Plan at Knob Hill
- Harrison Plan at Knob Hill
- Magnolia Plan at Knob Hill
- Maple Plan at Knob Hill
- Cannaberra Plan at Knob Hill
- 300 Red Bird Cir
- 304 Red Bird Cir
- 112 Orchard Crest Ln
- 104 Blossom Ct
- 303 Red Bird Cir
- 301 Red Bird Cir
- 305 Red Bird Cir
- 110 Orchard Crest Ln
- 227 Red Bird Cir
- 115 Orchard Crest Ln
- 307 Red Bird Cir
- 308 Red Bird Cir
- 113 Orchard Crest Ln
- 103 Blossom Ct
- 108 Orchard Crest Ln
- 111 Orchard Crest Ln
- 225 Red Bird Cir
- 105 Blossom Ct
- 111 Orchard Crest Ln
- 309 Red Bird Cir