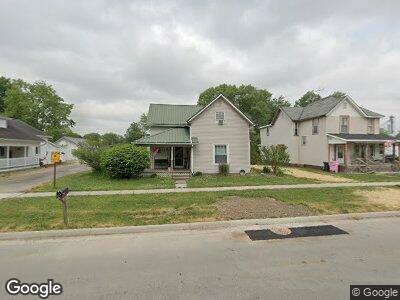
302 S Main St Grover Hill, OH 45849
Estimated Value: $68,943 - $107,000
3
Beds
1
Bath
1,452
Sq Ft
$55/Sq Ft
Est. Value
About This Home
This home is located at 302 S Main St, Grover Hill, OH 45849 and is currently estimated at $80,236, approximately $55 per square foot. 302 S Main St is a home located in Paulding County with nearby schools including Wayne Trace High School.
Ownership History
Date
Name
Owned For
Owner Type
Purchase Details
Closed on
Sep 30, 2022
Sold by
Williamson David L and Williamson Raye L
Bought by
Tu Properties Llc
Current Estimated Value
Purchase Details
Closed on
Nov 20, 2017
Sold by
Williamson Davidb L and Williamson Raye L
Bought by
Tu Propeties Llc
Home Financials for this Owner
Home Financials are based on the most recent Mortgage that was taken out on this home.
Original Mortgage
$25,000
Interest Rate
5%
Mortgage Type
Seller Take Back
Purchase Details
Closed on
Dec 16, 2016
Sold by
Williamson David L
Bought by
David L Williamson and Raye L Williamson
Home Financials for this Owner
Home Financials are based on the most recent Mortgage that was taken out on this home.
Interest Rate
4.16%
Purchase Details
Closed on
Aug 26, 1999
Bought by
Williamson David L
Purchase Details
Closed on
May 4, 1999
Sold by
Westrick Diana L
Bought by
Williamson David L
Purchase Details
Closed on
Jan 13, 1995
Bought by
Williamson David L
Create a Home Valuation Report for This Property
The Home Valuation Report is an in-depth analysis detailing your home's value as well as a comparison with similar homes in the area
Home Values in the Area
Average Home Value in this Area
Purchase History
| Date | Buyer | Sale Price | Title Company |
|---|---|---|---|
| Tu Properties Llc | -- | -- | |
| Tu Propeties Llc | -- | None Available | |
| David L Williamson | -- | -- | |
| Williamson David L | $23,000 | -- | |
| Williamson David L | $20,000 | -- | |
| Williamson David L | -- | -- |
Source: Public Records
Mortgage History
| Date | Status | Borrower | Loan Amount |
|---|---|---|---|
| Previous Owner | Tu Propeties Llc | $25,000 | |
| Previous Owner | David L Williamson | -- | |
| Previous Owner | Williamson David L | $567,000 |
Source: Public Records
Tax History Compared to Growth
Tax History
| Year | Tax Paid | Tax Assessment Tax Assessment Total Assessment is a certain percentage of the fair market value that is determined by local assessors to be the total taxable value of land and additions on the property. | Land | Improvement |
|---|---|---|---|---|
| 2024 | $1,790 | $21,280 | $1,750 | $19,530 |
| 2023 | $1,790 | $21,280 | $1,750 | $19,530 |
| 2022 | $1,044 | $21,280 | $1,750 | $19,530 |
| 2021 | $842 | $17,750 | $1,650 | $16,100 |
| 2020 | $864 | $17,750 | $1,650 | $16,100 |
| 2019 | $866 | $17,750 | $1,650 | $16,100 |
| 2018 | $1,266 | $17,750 | $1,650 | $16,100 |
| 2017 | $1,317 | $17,750 | $1,650 | $16,100 |
| 2016 | $1,316 | $17,750 | $1,650 | $16,100 |
| 2015 | $1,266 | $16,700 | $1,860 | $14,840 |
| 2014 | $1,212 | $16,700 | $1,860 | $14,840 |
| 2013 | $1,394 | $16,700 | $1,860 | $14,840 |
Source: Public Records
Map
Nearby Homes
- 100 N Maple St
- 301 E Wayne St
- 18698 Road 48
- 7970 Broughton Pike
- 12783 Road 82 Unit 10
- 12783 Road 82 Unit 8
- 12783 Road 82 Unit 1
- 20428 Road 120
- 225 2nd St
- 205 E Main
- 401 Main St
- 107 Superior St
- 7841 Road 25
- 23423 Road 104
- 16325 Road 25p
- 14855 Road 138
- 2580 County Road 79
- 172 S East Canal St
- 0 5th St Unit Lot 586 6112033
- 0 5th St Unit Lot 586 303234