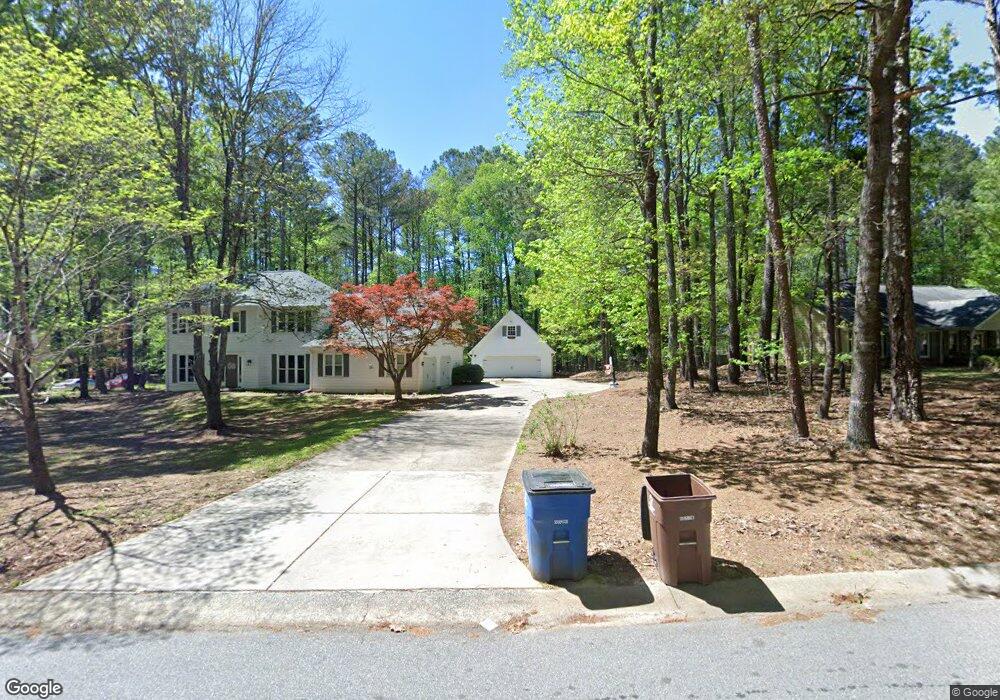
302 Sawmill Trace Peachtree City, GA 30269
Estimated Value: $516,193 - $613,000
--
Bed
--
Bath
2,333
Sq Ft
$241/Sq Ft
Est. Value
About This Home
This home is located at 302 Sawmill Trace, Peachtree City, GA 30269 and is currently estimated at $563,048, approximately $241 per square foot. 302 Sawmill Trace is a home located in Fayette County with nearby schools including Huddleston Elementary School, Booth Middle School, and McIntosh High School.
Ownership History
Date
Name
Owned For
Owner Type
Purchase Details
Closed on
Dec 17, 2020
Sold by
Nardone Laura A
Bought by
Rodriguez Ronald and Rodriguez Chelcie
Current Estimated Value
Home Financials for this Owner
Home Financials are based on the most recent Mortgage that was taken out on this home.
Original Mortgage
$332,000
Outstanding Balance
$295,579
Interest Rate
2.7%
Mortgage Type
New Conventional
Estimated Equity
$267,469
Purchase Details
Closed on
Nov 20, 2019
Sold by
Mullen Laura Ann
Bought by
Nardone Laura Ann
Purchase Details
Closed on
Apr 24, 2009
Sold by
Mullen Edward K
Bought by
Mullen Laura A
Purchase Details
Closed on
Aug 17, 2000
Sold by
Sells James O
Bought by
Mullen Edward K and Mullen Laura A
Purchase Details
Closed on
Mar 1, 1995
Sold by
Sells Linda J
Bought by
Sells James O
Create a Home Valuation Report for This Property
The Home Valuation Report is an in-depth analysis detailing your home's value as well as a comparison with similar homes in the area
Home Values in the Area
Average Home Value in this Area
Purchase History
| Date | Buyer | Sale Price | Title Company |
|---|---|---|---|
| Rodriguez Ronald | $415,000 | -- | |
| Nardone Laura Ann | -- | -- | |
| Mullen Laura A | -- | -- | |
| Mullen Edward K | $185,000 | -- | |
| Sells James O | $121,000 | -- |
Source: Public Records
Mortgage History
| Date | Status | Borrower | Loan Amount |
|---|---|---|---|
| Open | Rodriguez Ronald | $332,000 |
Source: Public Records
Tax History Compared to Growth
Tax History
| Year | Tax Paid | Tax Assessment Tax Assessment Total Assessment is a certain percentage of the fair market value that is determined by local assessors to be the total taxable value of land and additions on the property. | Land | Improvement |
|---|---|---|---|---|
| 2024 | $4,339 | $194,236 | $33,600 | $160,636 |
| 2023 | $3,831 | $186,600 | $33,600 | $153,000 |
| 2022 | $4,199 | $178,520 | $33,600 | $144,920 |
| 2021 | $3,784 | $142,180 | $20,900 | $121,280 |
| 2020 | $4,061 | $130,780 | $20,900 | $109,880 |
| 2019 | $3,850 | $124,740 | $20,900 | $103,840 |
| 2018 | $3,711 | $118,420 | $20,900 | $97,520 |
| 2017 | $3,437 | $109,100 | $20,900 | $88,200 |
| 2016 | $3,230 | $98,980 | $20,900 | $78,080 |
| 2015 | $3,011 | $90,940 | $20,900 | $70,040 |
| 2014 | $2,902 | $86,260 | $20,900 | $65,360 |
| 2013 | -- | $84,380 | $0 | $0 |
Source: Public Records
Map
Nearby Homes
- 206 Sandown Dr
- 103 Everhill
- 112 Kirton Turn
- 110 Kirton Turn
- 105 Shadowood Ln
- 120 Fountain Head
- 105 Highgreen Ridge
- 221 Caledonia Ct
- 104 Ridgefield Dr
- 401 Peachtree Club Dr
- 102 Spincast Ct
- 214 Windgate Ct
- 300 Martingale Dr
- 101 Bluegill Trace
- 1201 Loxley Cir
- LOT 12 Meadowlark Dr
- 118 Clarin Way
- 108 Summit Walk
- 95 Prestwick Ln
- 157 Rockspray Ridge
- 304 Sawmill Trace
- 300 Sawmill Trace
- 301 Sawmill Trace
- 306 Sawmill Trace
- 204 Sawmill Trace
- 209 Sandown Dr
- 211 Sandown Dr
- 207 Sandown Dr Unit 47
- 207 Sandown Dr
- 213 Sandown Dr
- 102 Sawtan Rim
- 215 Sandown Dr
- 101 Sawtan Rim
- 202 Sawmill Trace
- 104 Bowmoor Bank
- 205 Sandown Dr
- 217 Sandown Dr
- 106 Bowmoor Bank
- 103 Sawtan Rim
- 203 Sandown Dr