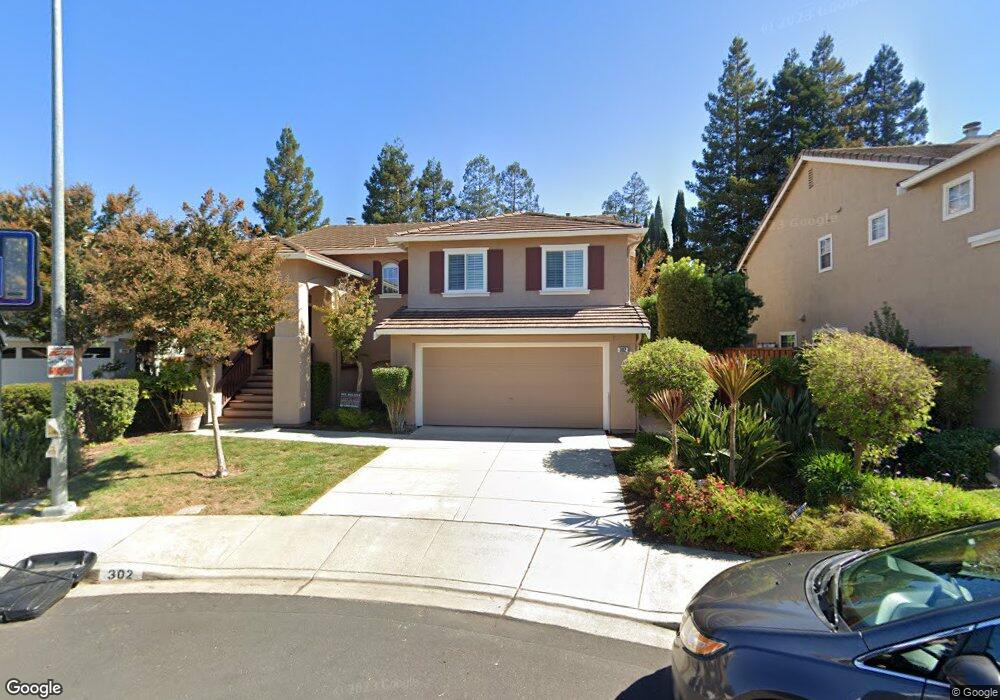
302 Shadowfalls Cir Martinez, CA 94553
Morello NeighborhoodEstimated Value: $874,820 - $1,030,000
3
Beds
3
Baths
2,044
Sq Ft
$473/Sq Ft
Est. Value
About This Home
This home is located at 302 Shadowfalls Cir, Martinez, CA 94553 and is currently estimated at $966,955, approximately $473 per square foot. 302 Shadowfalls Cir is a home located in Contra Costa County with nearby schools including Morello Park Elementary School, Martinez Junior High School, and Alhambra Senior High School.
Ownership History
Date
Name
Owned For
Owner Type
Purchase Details
Closed on
May 15, 2017
Sold by
Widman Steven Jeff and Bell Eric William
Bought by
Allred Jacob and Allred Victoria
Current Estimated Value
Home Financials for this Owner
Home Financials are based on the most recent Mortgage that was taken out on this home.
Original Mortgage
$514,500
Outstanding Balance
$427,870
Interest Rate
4.1%
Mortgage Type
New Conventional
Estimated Equity
$539,085
Purchase Details
Closed on
Nov 22, 1995
Sold by
Kaufman & Broad Of Northern California I
Bought by
Widman Steven Jeff and Bell Eric William
Home Financials for this Owner
Home Financials are based on the most recent Mortgage that was taken out on this home.
Original Mortgage
$225,740
Interest Rate
5.87%
Mortgage Type
Seller Take Back
Create a Home Valuation Report for This Property
The Home Valuation Report is an in-depth analysis detailing your home's value as well as a comparison with similar homes in the area
Home Values in the Area
Average Home Value in this Area
Purchase History
| Date | Buyer | Sale Price | Title Company |
|---|---|---|---|
| Allred Jacob | $735,000 | Old Republic Title Company | |
| Widman Steven Jeff | $238,000 | First American Title Guarant |
Source: Public Records
Mortgage History
| Date | Status | Borrower | Loan Amount |
|---|---|---|---|
| Open | Allred Jacob | $514,500 | |
| Previous Owner | Widman Steven Jeff | $225,740 |
Source: Public Records
Tax History
| Year | Tax Paid | Tax Assessment Tax Assessment Total Assessment is a certain percentage of the fair market value that is determined by local assessors to be the total taxable value of land and additions on the property. | Land | Improvement |
|---|---|---|---|---|
| 2025 | $11,223 | $853,024 | $417,807 | $435,217 |
| 2024 | $10,502 | $836,299 | $409,615 | $426,684 |
| 2023 | $10,502 | $819,902 | $401,584 | $418,318 |
| 2022 | $10,264 | $803,826 | $393,710 | $410,116 |
| 2021 | $10,004 | $788,066 | $385,991 | $402,075 |
| 2019 | $9,672 | $764,694 | $374,544 | $390,150 |
| 2018 | $9,410 | $749,700 | $367,200 | $382,500 |
| 2017 | $4,582 | $339,938 | $110,205 | $229,733 |
| 2016 | $4,271 | $333,274 | $108,045 | $225,229 |
| 2015 | $4,237 | $328,269 | $106,423 | $221,846 |
| 2014 | $4,177 | $321,840 | $104,339 | $217,501 |
Source: Public Records
Map
Nearby Homes
- 889 Palisade Dr
- 388 Mill Rd
- 194 Farm Ln Unit 89
- 415 Orchard View Ave
- 121 St Nazaire Ct
- 1383 Hull Ln
- 34 Midhill Rd
- 1080 Maywood Ln
- 1126 Maywood Ln Unit 50B
- 1014 Veterans Ct
- 745 Bayshore St
- 9 Morello Heights Dr
- 31 Denova Ln
- 1238 Center Ave
- 933 Country Run Dr
- 701 Center Ave Unit 99
- 51 Denova Ln
- 206 Buena Vida Ct
- 2900 Leslie Ave
- 1524 Ridgewood Dr
- 300 Shadowfalls Cir
- 304 Shadowfalls Cir
- 306 Shadowfalls Cir
- 815 Greenway Dr
- 4879 Shadowfalls Dr
- 308 Shadowfalls Cir
- 303 Shadowfalls Cir
- 820 Greenway Dr
- 305 Oakwood Cir
- 4885 Shadowfalls Dr
- 307 Oakwood Cir
- 310 Shadowfalls Cir
- 305 Shadowfalls Cir
- 4860 Shadowfalls Dr
- 303 Oakwood Cir
- 4889 Shadowfalls Dr
- 4872 Shadowfalls Dr
- 309 Oakwood Cir
- 839 Greenway Dr
- 201 Baylands Dr
Your Personal Tour Guide
Ask me questions while you tour the home.