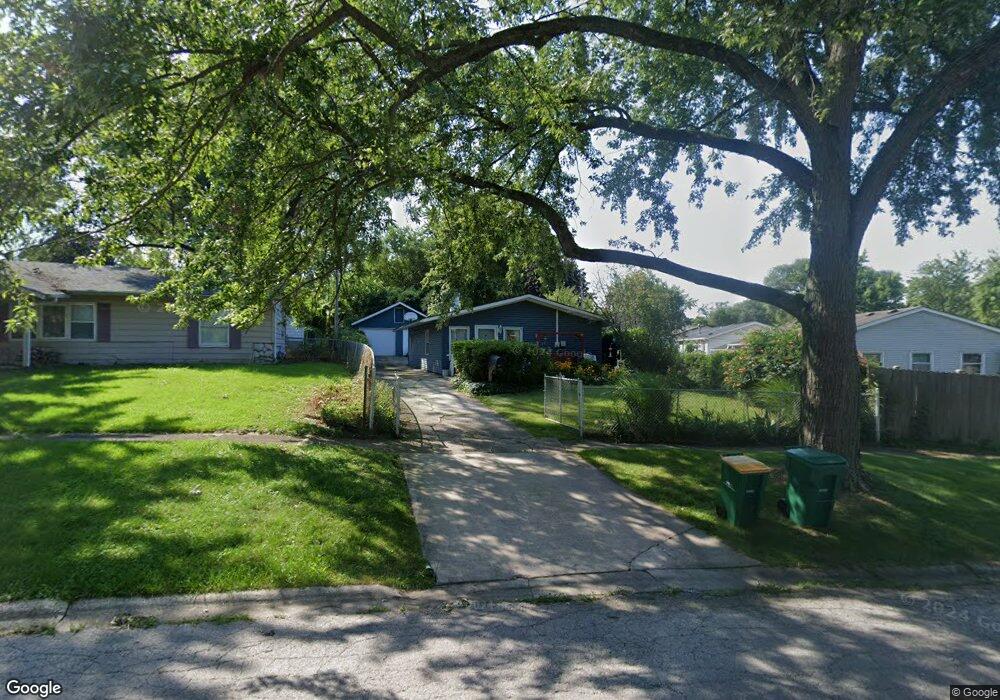
302 Stuart Rd Lockport, IL 60441
Estimated Value: $183,273 - $263,000
Studio
--
Bath
912
Sq Ft
$257/Sq Ft
Est. Value
About This Home
This home is located at 302 Stuart Rd, Lockport, IL 60441 and is currently estimated at $234,818, approximately $257 per square foot. 302 Stuart Rd is a home located in Will County with nearby schools including Walsh Elementary School, Ludwig Elementary School, and Reed Elementary School.
Ownership History
Date
Name
Owned For
Owner Type
Purchase Details
Closed on
Jan 25, 2005
Sold by
Pote Lawrence and Pote Beverly
Bought by
Pote Lawrence H and Pote Beverly A
Current Estimated Value
Home Financials for this Owner
Home Financials are based on the most recent Mortgage that was taken out on this home.
Original Mortgage
$119,625
Outstanding Balance
$61,123
Interest Rate
5.83%
Mortgage Type
Seller Take Back
Estimated Equity
$173,695
Purchase Details
Closed on
Jan 24, 2005
Sold by
Pote Timothy L and Forget Rachel
Bought by
Pote Lawrence and Pote Beverly
Home Financials for this Owner
Home Financials are based on the most recent Mortgage that was taken out on this home.
Original Mortgage
$119,625
Outstanding Balance
$61,123
Interest Rate
5.83%
Mortgage Type
Seller Take Back
Estimated Equity
$173,695
Purchase Details
Closed on
Feb 11, 1998
Sold by
Niemann John H and Niemann Kimberly A
Bought by
Pote Timothy
Home Financials for this Owner
Home Financials are based on the most recent Mortgage that was taken out on this home.
Original Mortgage
$62,000
Interest Rate
6.99%
Create a Home Valuation Report for This Property
The Home Valuation Report is an in-depth analysis detailing your home's value as well as a comparison with similar homes in the area
Home Values in the Area
Average Home Value in this Area
Purchase History
| Date | Buyer | Sale Price | Title Company |
|---|---|---|---|
| Pote Lawrence H | -- | -- | |
| Pote Lawrence | $135,000 | -- | |
| Pote Timothy | $87,000 | -- |
Source: Public Records
Mortgage History
| Date | Status | Borrower | Loan Amount |
|---|---|---|---|
| Open | Pote Lawrence | $119,625 | |
| Closed | Pote Timothy | $62,000 |
Source: Public Records
Tax History
| Year | Tax Paid | Tax Assessment Tax Assessment Total Assessment is a certain percentage of the fair market value that is determined by local assessors to be the total taxable value of land and additions on the property. | Land | Improvement |
|---|---|---|---|---|
| 2024 | $1,284 | $63,215 | $22,004 | $41,211 |
| 2023 | $1,284 | $56,751 | $19,754 | $36,997 |
| 2022 | $1,756 | $52,937 | $18,426 | $34,511 |
| 2021 | $1,761 | $49,748 | $17,316 | $32,432 |
| 2020 | $1,776 | $48,113 | $16,747 | $31,366 |
| 2019 | $1,772 | $45,605 | $15,874 | $29,731 |
| 2018 | $1,809 | $45,298 | $14,969 | $30,329 |
| 2017 | $1,833 | $42,762 | $14,131 | $28,631 |
| 2016 | $1,861 | $40,077 | $13,244 | $26,833 |
| 2015 | $1,926 | $35,308 | $11,668 | $23,640 |
| 2014 | $1,926 | $32,693 | $10,804 | $21,889 |
| 2013 | $1,926 | $33,360 | $11,024 | $22,336 |
Source: Public Records
Map
Nearby Homes
- 310 Mccameron Ave
- 927 Treeline Ct Unit A
- 936 Treeline Ct Unit 5B
- 1330 Lacoma Ct
- 629 Thornton St
- 1041 Ashley Ct S Unit 2D
- 805 Maryknoll Dr
- 417 Thornton St
- 514 N Lockwood Dr
- 134 S Jefferson St
- 904 Cove Ave
- 16740 W Saddlewood Dr
- 118 N State St
- 0 151st & MacGregor St Unit MRD11873272
- 0 Smith Rd South of 135th St Unit MRD12274096
- 0 N State St Unit 10995892
- 120 N State St
- 15303 S Oak Run Ct
- 107 S State St
- 1017 Putnam Dr
- 206 Macintyre St
- 204 Macintyre St
- 1012 Highland Ave
- 1014 Highland Ave Unit 1
- 202 Macintyre St Unit 1
- 304B Stuart Ct
- 1016 Highland Ave
- 301 Stuart Rd
- 305 Stuart Rd
- 1018 Highland Ave
- 205 Macintyre St
- 203 Macintyre St
- 207 Macintyre St
- 306 Stuart Rd
- 1004 Highland Ave Unit 1
- 304 Macintyre St Unit 1
- 301 Macintyre St
- 304 Stuart Rd Unit B
- 304 Stuart Rd
- 304 Stuart Rd Unit A
Your Personal Tour Guide
Ask me questions while you tour the home.