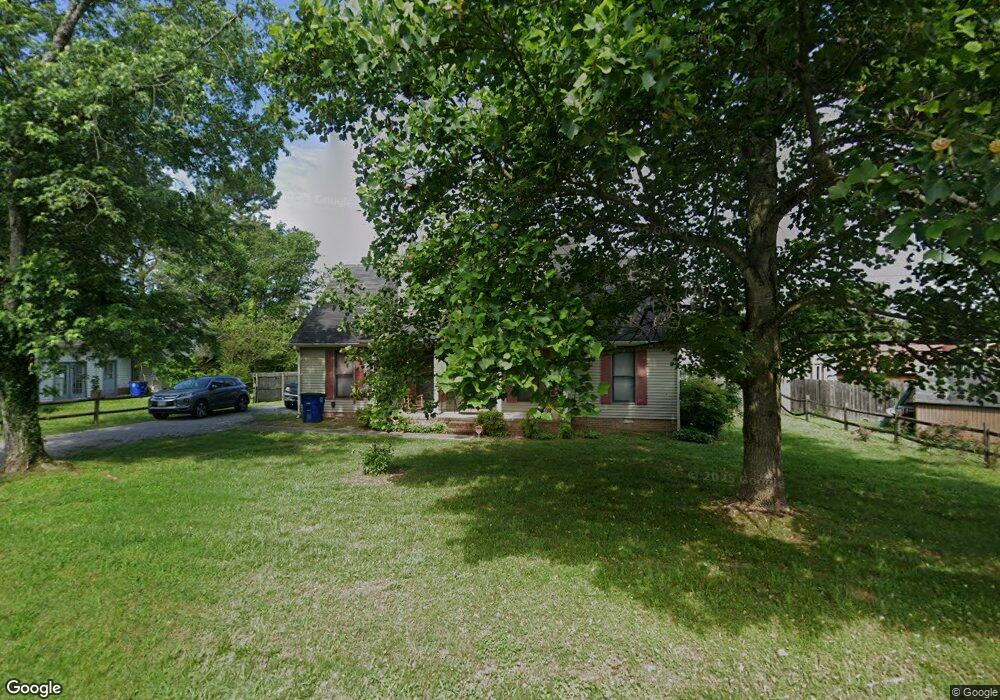
302 Tyne Rd Shelbyville, TN 37160
Estimated Value: $283,385 - $360,000
--
Bed
2
Baths
2,150
Sq Ft
$153/Sq Ft
Est. Value
About This Home
This home is located at 302 Tyne Rd, Shelbyville, TN 37160 and is currently estimated at $329,596, approximately $153 per square foot. 302 Tyne Rd is a home located in Bedford County with nearby schools including South Side Elementary School, Harris Middle School, and Christian Chapel Academy.
Ownership History
Date
Name
Owned For
Owner Type
Purchase Details
Closed on
Sep 23, 2002
Sold by
Cavalry Banking
Bought by
Lanier Thomas and Lanier Paulette D
Current Estimated Value
Purchase Details
Closed on
Jun 27, 2002
Sold by
Shepherd Michael and Shepherd Carol
Bought by
Cavalry Banking
Purchase Details
Closed on
Jan 21, 1999
Sold by
Phillips Phillip R
Bought by
Shepherd Michael and Shepherd Carol
Purchase Details
Closed on
Dec 31, 1996
Sold by
Scott Ronald and Scott Kathy
Bought by
Phillips Phillip R and Phillips Lori
Purchase Details
Closed on
Sep 21, 1995
Sold by
West C A
Bought by
Scott Ronald and Scott Kathy
Purchase Details
Closed on
Jan 27, 1989
Bought by
West C A
Purchase Details
Closed on
Apr 20, 1988
Bought by
Adcock Thurman Lee and Adcock Monica W
Purchase Details
Closed on
Dec 9, 1986
Bought by
Peels John L and Annie Mai
Create a Home Valuation Report for This Property
The Home Valuation Report is an in-depth analysis detailing your home's value as well as a comparison with similar homes in the area
Home Values in the Area
Average Home Value in this Area
Purchase History
| Date | Buyer | Sale Price | Title Company |
|---|---|---|---|
| Lanier Thomas | $95,000 | -- | |
| Cavalry Banking | $92,127 | -- | |
| Shepherd Michael | $111,000 | -- | |
| Phillips Phillip R | $89,900 | -- | |
| Scott Ronald | $79,500 | -- | |
| West C A | -- | -- | |
| Adcock Thurman Lee | -- | -- | |
| Peels John L | -- | -- |
Source: Public Records
Tax History Compared to Growth
Tax History
| Year | Tax Paid | Tax Assessment Tax Assessment Total Assessment is a certain percentage of the fair market value that is determined by local assessors to be the total taxable value of land and additions on the property. | Land | Improvement |
|---|---|---|---|---|
| 2025 | -- | $50,450 | $0 | $0 |
| 2024 | -- | $50,450 | $12,500 | $37,950 |
| 2023 | $1,920 | $50,450 | $12,500 | $37,950 |
| 2022 | $1,975 | $50,450 | $12,500 | $37,950 |
| 2021 | $1,793 | $50,450 | $12,500 | $37,950 |
| 2020 | $1,397 | $50,450 | $12,500 | $37,950 |
| 2019 | $1,397 | $31,550 | $5,250 | $26,300 |
| 2018 | $1,366 | $31,550 | $5,250 | $26,300 |
| 2017 | $1,366 | $31,550 | $5,250 | $26,300 |
| 2016 | $1,353 | $31,550 | $5,250 | $26,300 |
| 2015 | $1,354 | $31,550 | $5,250 | $26,300 |
| 2014 | $1,040 | $26,520 | $0 | $0 |
Source: Public Records
Map
Nearby Homes