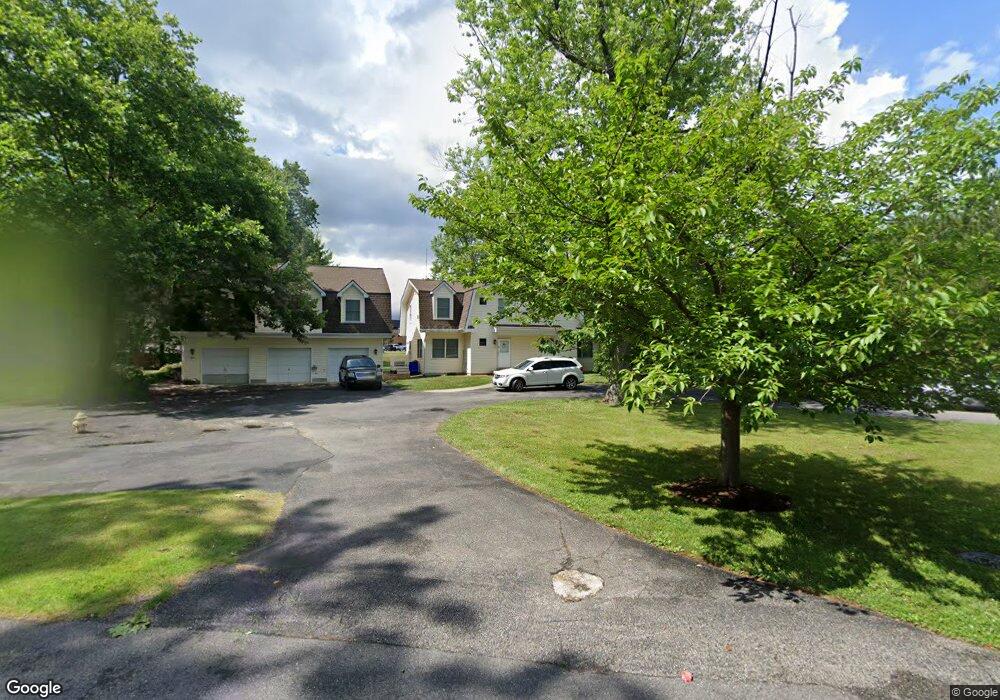
302 Unity Ln Annapolis, MD 21401
Parole NeighborhoodEstimated Value: $840,911 - $875,000
Studio
6
Baths
3,762
Sq Ft
$228/Sq Ft
Est. Value
About This Home
This home is located at 302 Unity Ln, Annapolis, MD 21401 and is currently estimated at $857,228, approximately $227 per square foot. 302 Unity Ln is a home located in Anne Arundel County with nearby schools including Rolling Knolls Elementary School, Wiley H. Bates Middle School, and Annapolis High School.
Ownership History
Date
Name
Owned For
Owner Type
Purchase Details
Closed on
Oct 26, 2023
Sold by
Moreland Jenny Bausum and Masters Judi Bausum
Bought by
Mccord James and Seeger Mackenzie
Current Estimated Value
Home Financials for this Owner
Home Financials are based on the most recent Mortgage that was taken out on this home.
Original Mortgage
$810,057
Outstanding Balance
$792,123
Interest Rate
7.19%
Mortgage Type
FHA
Estimated Equity
$65,105
Purchase Details
Closed on
Aug 22, 2023
Sold by
Doris L Bausum Revocable Trust
Bought by
Moreland Jenny Bausum and Masters Judi Bausum
Purchase Details
Closed on
Apr 9, 2008
Sold by
Bausum Doris L
Bought by
Bausum Doris L and Bausum Harold G
Purchase Details
Closed on
Feb 27, 2008
Sold by
Bausum Harold G
Bought by
Bausum Doris L
Purchase Details
Closed on
Dec 20, 2007
Sold by
Bausum Doris L
Bought by
Bausum Doris L and Bausum Harold G
Purchase Details
Closed on
Apr 12, 1999
Sold by
Bausum Harold G
Bought by
Bausum Harold G and Bausum Doris L
Create a Home Valuation Report for This Property
The Home Valuation Report is an in-depth analysis detailing your home's value as well as a comparison with similar homes in the area
Home Values in the Area
Average Home Value in this Area
Purchase History
| Date | Buyer | Sale Price | Title Company |
|---|---|---|---|
| Mccord James | $825,000 | Rgs Title | |
| Moreland Jenny Bausum | -- | None Listed On Document | |
| Bausum Doris L | -- | -- | |
| Bausum Doris L | -- | -- | |
| Bausum Doris L | -- | -- | |
| Bausum Harold G | -- | -- |
Source: Public Records
Mortgage History
| Date | Status | Borrower | Loan Amount |
|---|---|---|---|
| Open | Mccord James | $810,057 |
Source: Public Records
Tax History
| Year | Tax Paid | Tax Assessment Tax Assessment Total Assessment is a certain percentage of the fair market value that is determined by local assessors to be the total taxable value of land and additions on the property. | Land | Improvement |
|---|---|---|---|---|
| 2025 | $7,392 | $622,867 | -- | -- |
| 2024 | $7,392 | $592,333 | $0 | $0 |
Source: Public Records
Map
Nearby Homes
- 301 Unity Ln
- 2704 Summerview Way Unit 302
- 2704 Summerview Way Unit 103
- 2707 Summerview Way Unit 101
- 2702 Summerview Way Unit 103
- 2702 Summerview Way Unit 303
- 2733 Gingerview Ln
- 108 Sellew Rd
- 109 Sellew Rd
- 208 Sellew Rd
- 803 Coxswain Way Unit 203
- 105 Wallace Manor Rd
- 3029 Solstice Ln
- 371 Carriage Park Way
- 807 Eastern Point Rd
- 328 Bulwark Aly
- 321 Bulwark Aly
- 2942 Southaven Dr
- 810 Midship Ct
- 2941 Southaven Dr
Your Personal Tour Guide
Ask me questions while you tour the home.