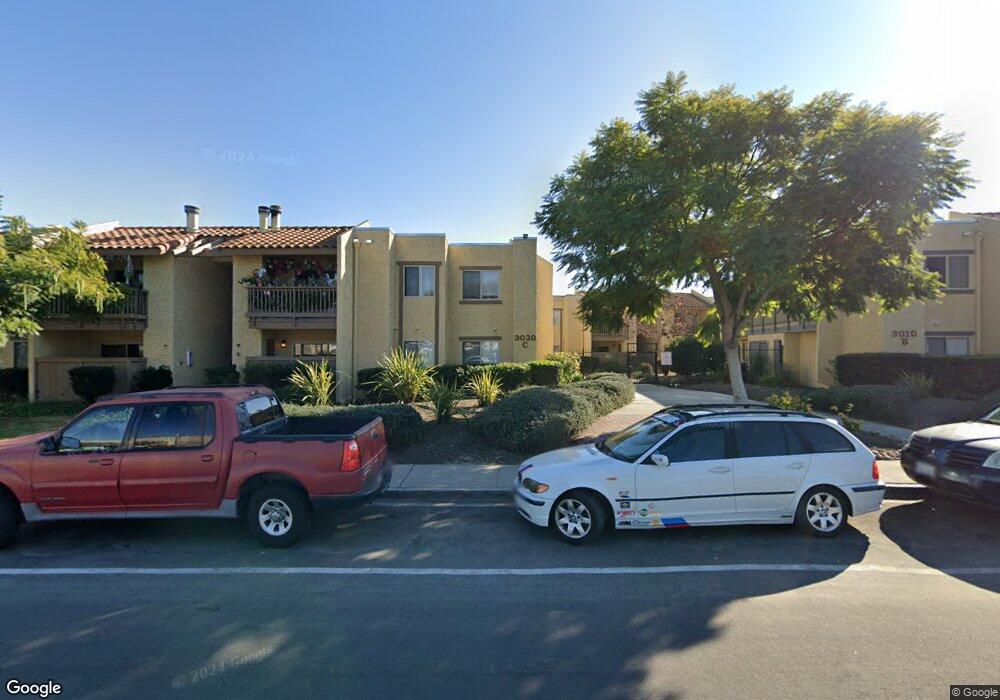
3020 Alta View Dr Unit 108 San Diego, CA 92139
Bay Terraces NeighborhoodEstimated Value: $461,286 - $495,000
2
Beds
2
Baths
900
Sq Ft
$529/Sq Ft
Est. Value
About This Home
This home is located at 3020 Alta View Dr Unit 108, San Diego, CA 92139 and is currently estimated at $476,072, approximately $528 per square foot. 3020 Alta View Dr Unit 108 is a home located in San Diego County with nearby schools including Zamorano Elementary School, Bell Middle School, and Morse High School.
Ownership History
Date
Name
Owned For
Owner Type
Purchase Details
Closed on
May 11, 2009
Sold by
Deutsche Bank National Trust Company
Bought by
Spilker Ricky O and Spilker Adriana P
Current Estimated Value
Home Financials for this Owner
Home Financials are based on the most recent Mortgage that was taken out on this home.
Original Mortgage
$79,000
Outstanding Balance
$49,833
Interest Rate
4.82%
Mortgage Type
Purchase Money Mortgage
Estimated Equity
$426,239
Purchase Details
Closed on
Mar 10, 2009
Sold by
Bantugan Lloyd Ryan and Deseo Bantugan Meliza
Bought by
Deutsche Bank National Trust Company
Purchase Details
Closed on
Jul 28, 2005
Sold by
Hammer Irp Bonita Llc
Bought by
Bantugan Lloyd Ryan and Bantugan Meliza Deseo
Home Financials for this Owner
Home Financials are based on the most recent Mortgage that was taken out on this home.
Original Mortgage
$265,600
Interest Rate
6.02%
Mortgage Type
Fannie Mae Freddie Mac
Create a Home Valuation Report for This Property
The Home Valuation Report is an in-depth analysis detailing your home's value as well as a comparison with similar homes in the area
Home Values in the Area
Average Home Value in this Area
Purchase History
| Date | Buyer | Sale Price | Title Company |
|---|---|---|---|
| Spilker Ricky O | $99,000 | Chicago Title Company | |
| Deutsche Bank National Trust Company | $122,000 | Accommodation | |
| Bantugan Lloyd Ryan | $332,000 | First American Title Company |
Source: Public Records
Mortgage History
| Date | Status | Borrower | Loan Amount |
|---|---|---|---|
| Open | Spilker Ricky O | $79,000 | |
| Previous Owner | Bantugan Lloyd Ryan | $265,600 |
Source: Public Records
Tax History Compared to Growth
Tax History
| Year | Tax Paid | Tax Assessment Tax Assessment Total Assessment is a certain percentage of the fair market value that is determined by local assessors to be the total taxable value of land and additions on the property. | Land | Improvement |
|---|---|---|---|---|
| 2025 | $1,481 | $127,466 | $63,733 | $63,733 |
| 2024 | $1,481 | $124,968 | $62,484 | $62,484 |
| 2023 | $1,446 | $122,518 | $61,259 | $61,259 |
| 2022 | $1,406 | $120,116 | $60,058 | $60,058 |
| 2021 | $1,395 | $117,762 | $58,881 | $58,881 |
| 2020 | $1,378 | $116,556 | $58,278 | $58,278 |
| 2019 | $1,352 | $114,272 | $57,136 | $57,136 |
| 2018 | $1,264 | $112,032 | $56,016 | $56,016 |
| 2017 | $1,232 | $109,836 | $54,918 | $54,918 |
| 2016 | $1,210 | $107,684 | $53,842 | $53,842 |
| 2015 | $1,192 | $106,068 | $53,034 | $53,034 |
| 2014 | $1,172 | $103,992 | $51,996 | $51,996 |
Source: Public Records
Map
Nearby Homes
- 3010 Alta View Dr Unit 107
- 7007 Appian Dr Unit B
- 6968 Appian Dr
- 7089 Wattle Dr
- 6811 Parkside Ave
- 2876 Casey St Unit B
- 6771 Parkside Ave
- 6795 Parkside Ave
- 6767 Parkside Ave
- 7479 Tooma St Unit B
- 6759 Parkside Ave
- 2588 Pennington Ln
- 2754 Alta View Dr
- 3069 Plaza Natalia
- 6872 Quebec Ct Unit 5
- 2920 Briarwood Rd
- 2920 Briarwood Rd Unit G11
- 2920 Briarwood Rd Unit C15
- 2920 Briarwood Rd Unit K13
- 2745 Kausman St
- 3040 Alta View Dr Unit 103
- 3030 Alta View Dr Unit 208
- 3010 Alta View Dr Unit B201
- 3030 Alta View Dr Unit C204
- 3040 Alta View Dr
- 3020 Alta View Dr
- 3010 Alta View Dr Unit B101
- 3010 Alta View Dr Unit 105
- 3020 Alta View Dr Unit 203
- 3020 Alta View Dr Unit 208
- 3020 Alta View Dr Unit 207
- 3020 Alta View Dr Unit 204
- 3020 Alta View Dr Unit E202
- 3020 Alta View Dr Unit E107
- 3020 Alta View Dr Unit 105
- 3020 Alta View Dr Unit 103
- 3020 Alta View Dr Unit 101
- 3040 Alta View Dr Unit D208
- 3040 Alta View Dr Unit 207
- 3020 Alta View Dr Unit 104