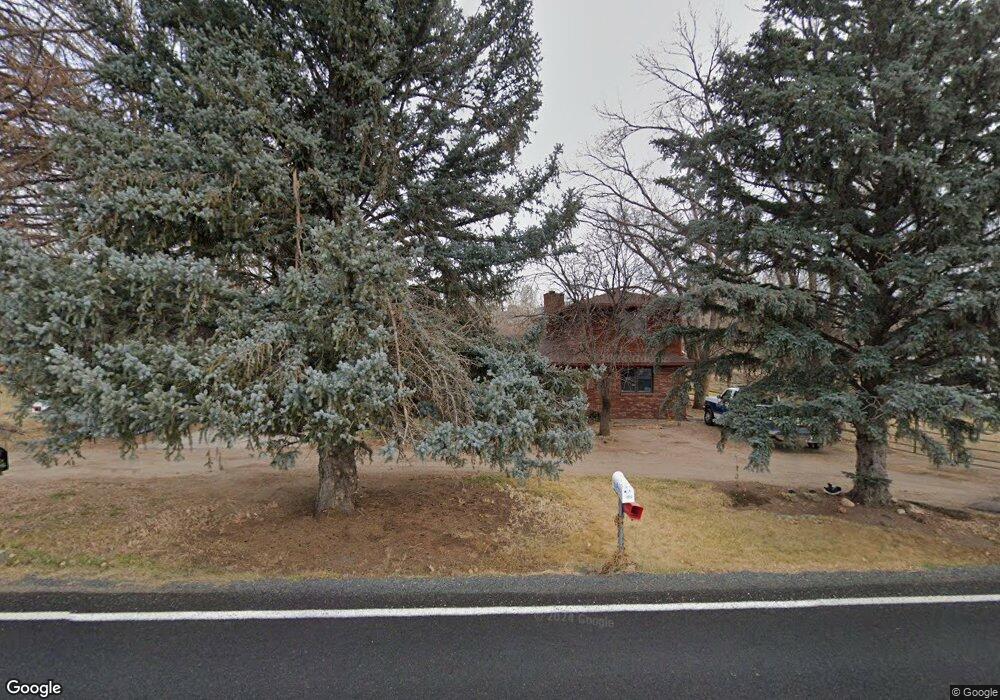
3020 Glade Rd Loveland, CO 80538
Estimated Value: $748,163 - $966,000
5
Beds
4
Baths
2,309
Sq Ft
$366/Sq Ft
Est. Value
About This Home
This home is located at 3020 Glade Rd, Loveland, CO 80538 and is currently estimated at $844,041, approximately $365 per square foot. 3020 Glade Rd is a home located in Larimer County with nearby schools including Big Thompson Elementary School, Walt Clark Middle School, and Thompson Valley High School.
Ownership History
Date
Name
Owned For
Owner Type
Purchase Details
Closed on
Nov 12, 1993
Sold by
Barr Donald D and Moore Sharon L
Bought by
Barr Donald D and Moore Barr Sharon L
Current Estimated Value
Purchase Details
Closed on
Jun 21, 1979
Sold by
Reed Charles E Virginia B
Bought by
Barr Donald D and Moore Sharon L
Purchase Details
Closed on
Jun 19, 1979
Sold by
Horne Lowell P and Horne Sara J
Bought by
Barr Donald D and Moore Barr Sharon L
Purchase Details
Closed on
Feb 25, 1976
Sold by
Breyer Louise A and Kay Louise
Bought by
Horne Lowell P and Horne Sara J
Purchase Details
Closed on
Sep 23, 1974
Sold by
Eastglade Development Company
Bought by
Goebel Lile R and Goebel Faye
Purchase Details
Closed on
Jan 22, 1966
Sold by
Osborn Harlan E and Osborn Lois A
Bought by
Eastglade Development Company
Purchase Details
Closed on
Sep 2, 1933
Sold by
Barr Donald D and Moore Sharon L
Bought by
Barr Donald D and Barr Sharon L
Create a Home Valuation Report for This Property
The Home Valuation Report is an in-depth analysis detailing your home's value as well as a comparison with similar homes in the area
Home Values in the Area
Average Home Value in this Area
Purchase History
| Date | Buyer | Sale Price | Title Company |
|---|---|---|---|
| Barr Donald D | -- | -- | |
| Barr Donald D | $3,500 | -- | |
| Barr Donald D | $56,400 | -- | |
| Horne Lowell P | $29,000 | -- | |
| Goebel Lile R | -- | -- | |
| Eastglade Development Company | $1,000 | -- | |
| Barr Donald D | -- | -- |
Source: Public Records
Tax History Compared to Growth
Tax History
| Year | Tax Paid | Tax Assessment Tax Assessment Total Assessment is a certain percentage of the fair market value that is determined by local assessors to be the total taxable value of land and additions on the property. | Land | Improvement |
|---|---|---|---|---|
| 2025 | $3,028 | $47,570 | $8,710 | $38,860 |
| 2024 | $2,922 | $47,570 | $8,710 | $38,860 |
| 2022 | $2,220 | $35,111 | $16,958 | $18,153 |
| 2021 | $2,279 | $36,122 | $17,446 | $18,676 |
| 2020 | $2,485 | $38,746 | $17,446 | $21,300 |
| 2019 | $2,443 | $38,746 | $17,446 | $21,300 |
| 2018 | $1,699 | $28,051 | $7,200 | $20,851 |
| 2017 | $1,462 | $28,051 | $7,200 | $20,851 |
| 2016 | $1,083 | $22,893 | $7,960 | $14,933 |
| 2015 | $1,074 | $22,890 | $7,960 | $14,930 |
| 2014 | $1,568 | $21,090 | $7,960 | $13,130 |
Source: Public Records
Map
Nearby Homes
- 3604 Glade Rd
- 3064 Wildes Rd
- 7467 W Us Highway 34
- 1703 N County Road 23h
- 7831 W Us Highway 34
- 5417 W US Highway 34
- 1828 N County Road 29
- 0 Soaring Eagle Unit 1024864
- 4033 Backbone Dr
- 712 Colt Dr
- 5925 Sacajawea Way
- 512 Mustang Dr
- 7864 Heart J Trail
- 240 Garnet Valley Ct
- 3005 N County Road 29
- 2301 Juniper Ln
- 1701 Firerock Ct
- 5272 Fox Hollow Ct
- 5801 Norwood Ave
- 1913 Skyrock Rd
- 3004 Glade Rd
- 2920 Glade Rd
- 3105 Rocky View Rd
- 3105 Rocky View Rd
- 3013 Rocky View Rd
- 2914 Glade Rd
- 3003 Rocky View Rd
- 2910 Glade Rd
- 2913 Glade Rd
- 6609 W 32nd St
- 2860 Glade Rd
- 2906 Glade Rd
- 6601 W 32nd St
- 3209 Glade Rd
- 2866 Glade Rd
- 6513 W 32nd St
- 3012 Rocky View Rd
- 6506 W 32nd St
- 3229 Glade Rd
- 6755 W County Road 24