3020 Spencer Mill Rd Bon Aqua, TN 37025
Estimated Value: $481,994 - $683,000
--
Bed
2
Baths
1,755
Sq Ft
$333/Sq Ft
Est. Value
About This Home
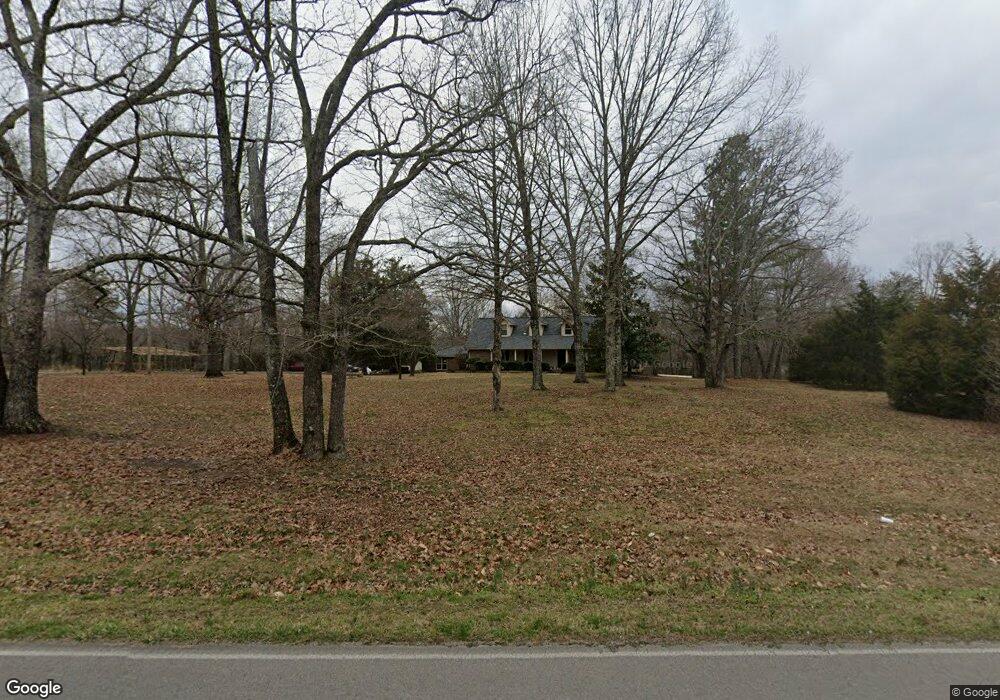
This home is located at 3020 Spencer Mill Rd, Bon Aqua, TN 37025 and is currently estimated at $584,749, approximately $333 per square foot. 3020 Spencer Mill Rd is a home located in Dickson County with nearby schools including Stuart Burns Elementary School, Burns Middle School, and Dickson County High School.
Ownership History
Date
Name
Owned For
Owner Type
Purchase Details
Closed on
Jun 24, 2021
Sold by
Zavos Victoria Lyn
Bought by
Sims Joshua Michael
Current Estimated Value
Purchase Details
Closed on
Jul 13, 2016
Sold by
Bohannon Bryan G
Bought by
Zavos Lyn Victoria
Home Financials for this Owner
Home Financials are based on the most recent Mortgage that was taken out on this home.
Original Mortgage
$190,400
Interest Rate
3.63%
Mortgage Type
New Conventional
Purchase Details
Closed on
Oct 11, 2005
Sold by
Daugherty Carl A
Bought by
Bohannon Bryan G
Home Financials for this Owner
Home Financials are based on the most recent Mortgage that was taken out on this home.
Original Mortgage
$180,240
Interest Rate
5.71%
Purchase Details
Closed on
Jan 19, 1999
Sold by
Daugherty Carl A
Bought by
Lankford Dwight
Purchase Details
Closed on
Mar 31, 1987
Bought by
Daugherty Carl A
Purchase Details
Closed on
Jul 27, 1976
Bought by
Hester John H
Create a Home Valuation Report for This Property
The Home Valuation Report is an in-depth analysis detailing your home's value as well as a comparison with similar homes in the area
Home Values in the Area
Average Home Value in this Area
Purchase History
| Date | Buyer | Sale Price | Title Company |
|---|---|---|---|
| Sims Joshua Michael | -- | Homestead Title & Escrow Llc | |
| Zavos Lyn Victoria | -- | -- | |
| Zavos Victoria Lyn | -- | -- | |
| Bohannon Bryan G | $225,300 | -- | |
| Lankford Dwight | $30,000 | -- | |
| Daugherty Carl A | $84,000 | -- | |
| Hester John H | -- | -- |
Source: Public Records
Mortgage History
| Date | Status | Borrower | Loan Amount |
|---|---|---|---|
| Previous Owner | Zavos Victoria Lyn | $190,400 | |
| Previous Owner | Hester John H | $180,240 | |
| Previous Owner | Hester John H | $45,060 |
Source: Public Records
Tax History Compared to Growth
Tax History
| Year | Tax Paid | Tax Assessment Tax Assessment Total Assessment is a certain percentage of the fair market value that is determined by local assessors to be the total taxable value of land and additions on the property. | Land | Improvement |
|---|---|---|---|---|
| 2025 | $1,932 | $114,325 | $0 | $0 |
| 2024 | $1,932 | $114,325 | $50,200 | $64,125 |
| 2023 | $1,615 | $68,725 | $21,025 | $47,700 |
| 2022 | $1,615 | $68,725 | $21,025 | $47,700 |
| 2021 | $1,615 | $68,725 | $21,025 | $47,700 |
| 2020 | $1,615 | $68,725 | $21,025 | $47,700 |
| 2019 | $1,615 | $68,725 | $21,025 | $47,700 |
| 2018 | $1,589 | $58,850 | $25,000 | $33,850 |
| 2017 | $1,584 | $58,650 | $25,000 | $33,650 |
| 2016 | $1,584 | $58,650 | $25,000 | $33,650 |
| 2015 | $1,550 | $53,450 | $25,000 | $28,450 |
| 2014 | $1,550 | $53,450 | $25,000 | $28,450 |
Source: Public Records
Map
Nearby Homes
- 108 Brook Hollow Ct
- 11065 New Cut Off Rd
- 10924 Rials Branch Rd
- 10912 Old Cox Pike
- 7329 Old Cox Pike
- 7646 Highway 100
- 0 Hunziker Ln Unit RTC2785103
- 0 Hunziker Ln Unit RTC2785104
- 0 Hunziker Ln Unit RTC2785102
- 0 Hunziker Ln Unit RTC2785101
- 0 Hunziker Ln Unit RTC2785100
- 7303 Dug Hill Rd
- 7371 Sugar Camp Hollow Rd
- 0 Liberty Rd
- 0 Eli Rd
- 3017 Fairview Blvd
- 7483 Liberty Rd
- 921 Eli Rd
- 7121 Tennessee 100
- 7413 Black Fox Dr
- 3019 Spencer Mill Rd
- 2996 Spencer Mill Rd
- 3010 Spencer Mill Rd
- 11283 Spencer Mill Rd
- 3025 Spencer Mill Rd
- 2994 Spencer Mill Rd
- 2 Spencer Mill Rd
- 2992 Spencer Mill Rd
- 2992 Spencer Mill
- 2993 Spencer Mill Rd
- 2990 Spencer Mill Rd
- 100 Jacobs Way
- 2980 Spencer Mill Rd
- 101 Jacobs Way
- 0 Brook Holw Ct Unit 2256888
- 104 Jacobs Way
- 0 Brook Hollow Ct Unit RTC2362525
- 0 Brook Hollow Ct Unit RTC2362524
- 0 Brook Hollow Ct Unit 2055344
- 101 Amelia Dr