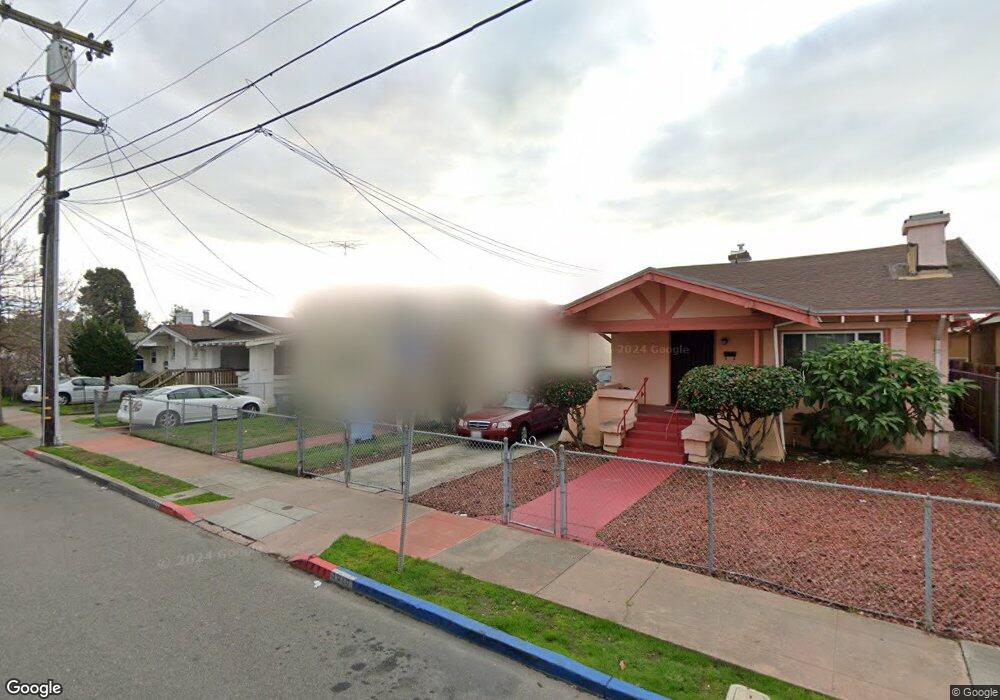
3020 Stanton St Berkeley, CA 94702
West Berkeley NeighborhoodEstimated Value: $1,192,590 - $1,306,000
3
Beds
1
Bath
1,464
Sq Ft
$854/Sq Ft
Est. Value
About This Home
This home is located at 3020 Stanton St, Berkeley, CA 94702 and is currently estimated at $1,250,898, approximately $854 per square foot. 3020 Stanton St is a home located in Alameda County with nearby schools including Malcolm X Elementary School, Washington Elementary School, and Oxford Elementary School.
Ownership History
Date
Name
Owned For
Owner Type
Purchase Details
Closed on
Jun 17, 2020
Sold by
Kim Sylvie J and Mah Christopher B
Bought by
Kim Sylvie J and Mah Christopher B
Current Estimated Value
Purchase Details
Closed on
May 8, 2019
Sold by
2003 Maybelle Ruth Lester Revocable Tr
Bought by
Kim Sylvie J and Mah Christopher B
Home Financials for this Owner
Home Financials are based on the most recent Mortgage that was taken out on this home.
Original Mortgage
$810,000
Outstanding Balance
$709,246
Interest Rate
4%
Mortgage Type
New Conventional
Estimated Equity
$541,652
Create a Home Valuation Report for This Property
The Home Valuation Report is an in-depth analysis detailing your home's value as well as a comparison with similar homes in the area
Home Values in the Area
Average Home Value in this Area
Purchase History
| Date | Buyer | Sale Price | Title Company |
|---|---|---|---|
| Kim Sylvie J | -- | None Available | |
| Kim Sylvie J | $900,000 | First American Title Company |
Source: Public Records
Mortgage History
| Date | Status | Borrower | Loan Amount |
|---|---|---|---|
| Open | Kim Sylvie J | $810,000 |
Source: Public Records
Tax History
| Year | Tax Paid | Tax Assessment Tax Assessment Total Assessment is a certain percentage of the fair market value that is determined by local assessors to be the total taxable value of land and additions on the property. | Land | Improvement |
|---|---|---|---|---|
| 2025 | $15,833 | $1,018,173 | $529,862 | $495,311 |
| 2024 | $15,833 | $998,074 | $519,474 | $485,600 |
| 2023 | $15,461 | $985,370 | $509,290 | $476,080 |
| 2022 | $15,359 | $959,052 | $499,305 | $466,747 |
| 2021 | $15,159 | $920,504 | $489,516 | $437,988 |
| 2020 | $14,459 | $918,000 | $484,500 | $433,500 |
| 2019 | $3,643 | $52,969 | $27,034 | $25,935 |
| 2018 | $3,520 | $51,930 | $26,504 | $25,426 |
| 2017 | $3,363 | $50,912 | $25,984 | $24,928 |
| 2016 | $3,136 | $49,914 | $25,475 | $24,439 |
| 2015 | $3,062 | $49,164 | $25,092 | $24,072 |
| 2014 | $2,977 | $48,202 | $24,601 | $23,601 |
Source: Public Records
Map
Nearby Homes
- 1507 Prince St
- 2922 Stanton St
- 3000 Acton St
- 3101 Sacramento St
- 1538 Ashby Ave
- 1314 Ashby Ave
- 3114 California St
- 3138 California St
- 3032 Mabel St
- 2829 California St
- 3224 Sacramento St
- 1237 Ashby Ave
- 1080 67th St
- 2790 Sacramento St
- 2782 Sacramento St
- 2774 Sacramento St
- 2758 Sacramento St
- 1450 Ward St
- 2750 Sacramento St
- 1046 Alcatraz Ave
Your Personal Tour Guide
Ask me questions while you tour the home.