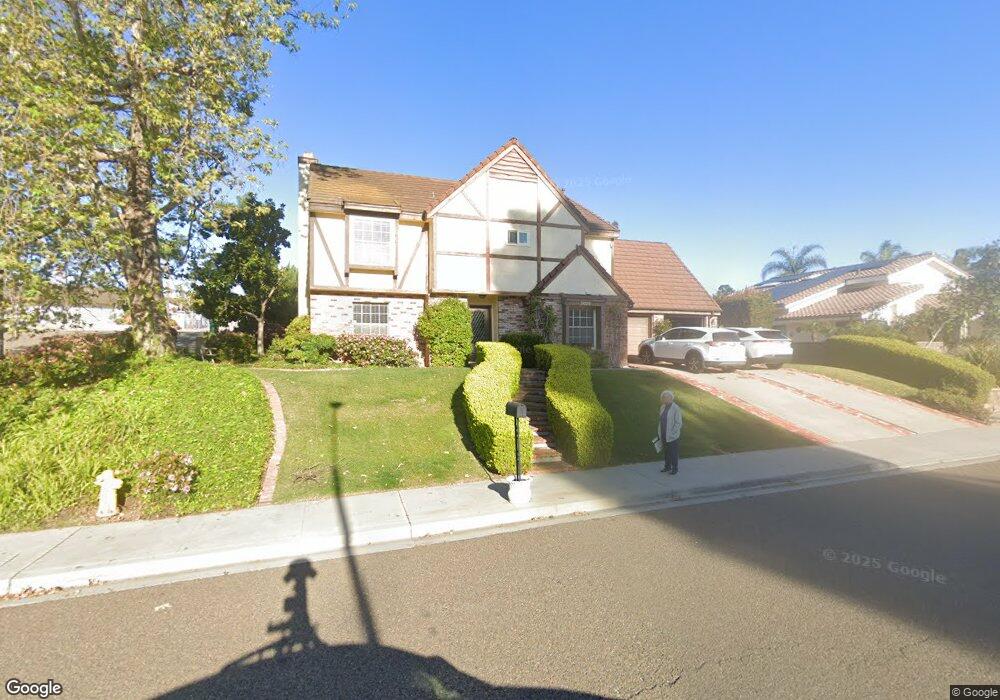
3020 Unicornio St Carlsbad, CA 92009
La Costa NeighborhoodEstimated Value: $1,786,584 - $2,207,000
4
Beds
3
Baths
2,989
Sq Ft
$662/Sq Ft
Est. Value
About This Home
This home is located at 3020 Unicornio St, Carlsbad, CA 92009 and is currently estimated at $1,980,146, approximately $662 per square foot. 3020 Unicornio St is a home located in San Diego County with nearby schools including La Costa Meadows Elementary, San Elijo Middle School, and San Marcos High School.
Ownership History
Date
Name
Owned For
Owner Type
Purchase Details
Closed on
Jun 13, 2022
Sold by
Tapia Louis A and Tapia Jean M
Bought by
Tapia Family Trust and Tapia
Current Estimated Value
Purchase Details
Closed on
Nov 24, 1997
Sold by
Macaluso Gerard A and Macaluso Patricia A
Bought by
Tapia Louis A and Tapia Jean M
Home Financials for this Owner
Home Financials are based on the most recent Mortgage that was taken out on this home.
Original Mortgage
$333,600
Interest Rate
7.22%
Purchase Details
Closed on
Aug 13, 1992
Purchase Details
Closed on
Feb 15, 1989
Create a Home Valuation Report for This Property
The Home Valuation Report is an in-depth analysis detailing your home's value as well as a comparison with similar homes in the area
Home Values in the Area
Average Home Value in this Area
Purchase History
| Date | Buyer | Sale Price | Title Company |
|---|---|---|---|
| Tapia Family Trust | -- | None Listed On Document | |
| Tapia Louis A | $417,000 | Old Republic Title Company | |
| -- | $365,000 | -- | |
| -- | $325,000 | -- |
Source: Public Records
Mortgage History
| Date | Status | Borrower | Loan Amount |
|---|---|---|---|
| Previous Owner | Tapia Louis A | $333,600 |
Source: Public Records
Tax History
| Year | Tax Paid | Tax Assessment Tax Assessment Total Assessment is a certain percentage of the fair market value that is determined by local assessors to be the total taxable value of land and additions on the property. | Land | Improvement |
|---|---|---|---|---|
| 2025 | $7,836 | $673,667 | $312,106 | $361,561 |
| 2024 | $7,836 | $660,459 | $305,987 | $354,472 |
| 2023 | $7,641 | $647,510 | $299,988 | $347,522 |
| 2022 | $7,502 | $634,814 | $294,106 | $340,708 |
| 2021 | $7,347 | $622,368 | $288,340 | $334,028 |
| 2020 | $7,246 | $615,987 | $285,384 | $330,603 |
| 2019 | $7,168 | $603,910 | $279,789 | $324,121 |
| 2018 | $6,952 | $592,069 | $274,303 | $317,766 |
| 2017 | $91 | $580,461 | $268,925 | $311,536 |
| 2016 | $6,725 | $569,080 | $263,652 | $305,428 |
| 2015 | $6,601 | $560,533 | $259,692 | $300,841 |
| 2014 | $6,428 | $549,553 | $254,605 | $294,948 |
Source: Public Records
Map
Nearby Homes
- 6981 Ballena Way Unit 13
- 6971 Ballena Way Unit 2
- 3211 Sirena Vista Way Unit 116
- 2930 Rancho Cortes
- 6561 Corte Cisco
- 6603 Santa Isabel St Unit C
- 7090 Corintia St
- 6428 Chiriqui Ln
- 6673 Corte Maria
- 2811 Unicornio St
- 6663 Sitio Palmas
- 2851 Cebu Place
- 6412 Terraza Portico
- 2718 Socorro Ln
- 6801 6803 El Fuerte St
- 2767 Vista Del Oro
- 3221 Corte Tamarindo
- 6374 Paseo Aspada
- 6759 Paseo Del Vista
- 6430 La Vanco Ct
- 3022 Unicornio St
- 3018 Xana Way
- 3010 Xana Way
- 3024 Unicornio St
- 3016 Xana Way
- 2939 Cacatua St
- 3028 Unicornio St
- 3006 Unicornio St
- 3012 Xana Way
- 2933 Cacatua St
- 3014 Xana Way
- 2927 Cacatua St
- 3002 Unicornio St
- 6571 Via Barona
- 2921 Cacatua St
- 3102 Unicornio St
- 6573 Via Barona
- 6545 Via Barona
- 6543 Via Barona
- 2915 Cacatua St
Your Personal Tour Guide
Ask me questions while you tour the home.