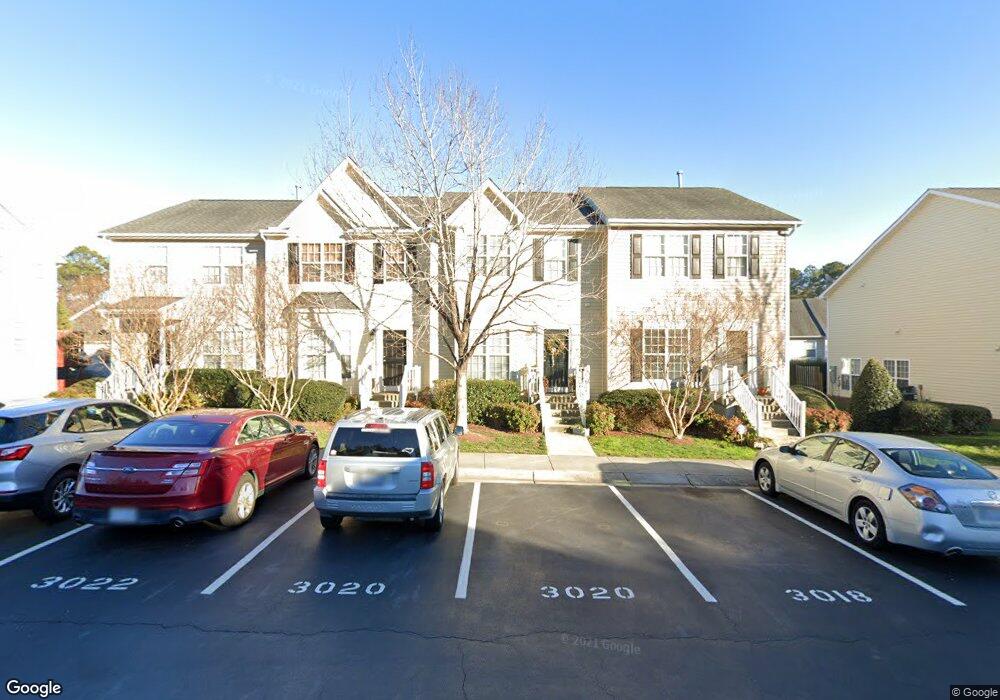
3020 Winding Waters Way Raleigh, NC 27614
Bedford at Falls River NeighborhoodEstimated Value: $346,392 - $359,000
4
Beds
4
Baths
2,202
Sq Ft
$159/Sq Ft
Est. Value
About This Home
This home is located at 3020 Winding Waters Way, Raleigh, NC 27614 and is currently estimated at $351,098, approximately $159 per square foot. 3020 Winding Waters Way is a home located in Wake County with nearby schools including Abbotts Creek Elementary School, Wakefield Middle, and Wakefield High School.
Ownership History
Date
Name
Owned For
Owner Type
Purchase Details
Closed on
Mar 10, 2015
Sold by
Safita Llc
Bought by
Constant Llc
Current Estimated Value
Purchase Details
Closed on
May 19, 2011
Sold by
Bayview Loan Servicing Llc
Bought by
Jabbour Hassan and Jabbour Widdad
Home Financials for this Owner
Home Financials are based on the most recent Mortgage that was taken out on this home.
Original Mortgage
$116,000
Interest Rate
4.88%
Mortgage Type
New Conventional
Purchase Details
Closed on
Nov 1, 2010
Sold by
Hernandez Mario and Hernandez Kristen
Bought by
Bayview Loan Servicing Lcc
Purchase Details
Closed on
Aug 8, 2006
Sold by
K Hovnanian Homes Of North Carolina Inc
Bought by
Hernandez Mario and Hernandez Kristin
Home Financials for this Owner
Home Financials are based on the most recent Mortgage that was taken out on this home.
Original Mortgage
$172,450
Interest Rate
6.67%
Mortgage Type
VA
Purchase Details
Closed on
Dec 6, 2004
Sold by
Brandywine Llc
Bought by
The New Fortis Corp
Create a Home Valuation Report for This Property
The Home Valuation Report is an in-depth analysis detailing your home's value as well as a comparison with similar homes in the area
Home Values in the Area
Average Home Value in this Area
Purchase History
| Date | Buyer | Sale Price | Title Company |
|---|---|---|---|
| Constant Llc | $168,000 | None Available | |
| Jabbour Hassan | $145,000 | None Available | |
| Bayview Loan Servicing Lcc | $130,000 | None Available | |
| Hernandez Mario | $172,500 | None Available | |
| The New Fortis Corp | $1,704,500 | -- |
Source: Public Records
Mortgage History
| Date | Status | Borrower | Loan Amount |
|---|---|---|---|
| Previous Owner | Jabbour Hassan | $116,000 | |
| Previous Owner | Hernandez Mario | $172,450 |
Source: Public Records
Tax History Compared to Growth
Tax History
| Year | Tax Paid | Tax Assessment Tax Assessment Total Assessment is a certain percentage of the fair market value that is determined by local assessors to be the total taxable value of land and additions on the property. | Land | Improvement |
|---|---|---|---|---|
| 2025 | $3,036 | $345,879 | $80,000 | $265,879 |
| 2024 | $3,024 | $345,879 | $80,000 | $265,879 |
| 2023 | $2,465 | $224,350 | $50,000 | $174,350 |
| 2022 | $2,292 | $224,350 | $50,000 | $174,350 |
| 2021 | $2,203 | $224,350 | $50,000 | $174,350 |
| 2020 | $2,163 | $224,350 | $50,000 | $174,350 |
| 2019 | $2,187 | $187,005 | $46,000 | $141,005 |
| 2018 | $2,063 | $187,005 | $46,000 | $141,005 |
| 2017 | $1,965 | $187,005 | $46,000 | $141,005 |
| 2016 | $1,925 | $187,005 | $46,000 | $141,005 |
| 2015 | -- | $187,883 | $46,000 | $141,883 |
| 2014 | $1,865 | $187,883 | $46,000 | $141,883 |
Source: Public Records
Map
Nearby Homes
- 3123 Winding Waters Way
- 2933 Grandview Heights Ln
- 10859 Bedfordtown Dr
- 10714 Bedfordtown Dr
- 11309 Shadow Elms Ln
- 2408 Gerber Ct
- 2709 Willow Pines Place
- 11006 Connally Ln
- 10638 Cardington Ln
- 10603 Friendly Neighbor Ln
- 2220 Raven Rd Unit 104
- 2221 Valley Edge Dr Unit 105
- 2740 Cloud Mist Cir
- 2210 Raven Rd Unit 105
- 2210 Raven Rd Unit 106
- 2220 Valley Edge Dr Unit 103
- 2220 Valley Edge Dr Unit 106
- 3405 van Hessen Dr
- 2106 Cloud Cover
- 2728 Cloud Mist Cir
- 3022 Winding Waters Way
- 3018 Winding Waters Way
- 3024 Winding Waters Way
- 3014 Winding Waters Way
- 3052 Winding Waters Way
- 3028 Winding Waters Way
- 3012 Winding Waters Way
- 3012 Winding Waters Way Unit 978
- 3043 Settle In Ln
- 3041 Settle In Ln
- 3045 Settle In Ln
- 3030 Winding Waters Way
- 3010 Winding Waters Way
- 3029 Settle In Ln
- 3051 Settle In Ln
- 3053 Settle In Ln
- 3032 Winding Waters Way
- 3025 Settle In Ln
- 3015 Winding Waters Way
- 3055 Settle In Ln