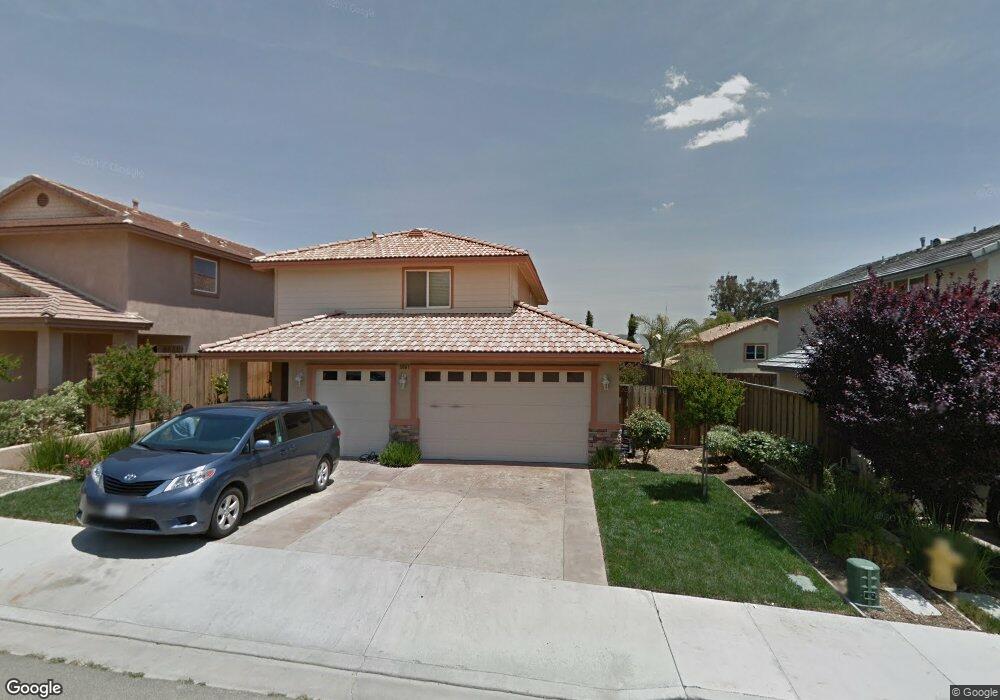
30208 Baum Ave Lake Elsinore, CA 92530
Country Club Heights NeighborhoodEstimated Value: $515,000 - $584,000
3
Beds
3
Baths
1,629
Sq Ft
$331/Sq Ft
Est. Value
About This Home
This home is located at 30208 Baum Ave, Lake Elsinore, CA 92530 and is currently estimated at $539,461, approximately $331 per square foot. 30208 Baum Ave is a home located in Riverside County with nearby schools including Elsinore Elementary School, Elsinore Middle School, and Temescal Canyon High School.
Ownership History
Date
Name
Owned For
Owner Type
Purchase Details
Closed on
Feb 27, 2014
Sold by
Rocafuerte Henry R
Bought by
Rocafuerte Henry R and Brolderocafuerte Irene
Current Estimated Value
Purchase Details
Closed on
Aug 31, 2011
Sold by
Pacific Horizon Builders Inc
Bought by
Rocafuerte Henry R
Home Financials for this Owner
Home Financials are based on the most recent Mortgage that was taken out on this home.
Original Mortgage
$214,325
Interest Rate
4.37%
Mortgage Type
FHA
Purchase Details
Closed on
Feb 23, 2006
Sold by
Hagan Investments Inc
Bought by
Swenson Steve and Allan Mark
Purchase Details
Closed on
Jul 21, 2004
Sold by
Russel Paula
Bought by
Hagan Investments Inc
Purchase Details
Closed on
Apr 25, 2002
Sold by
Mejia Robert
Bought by
Russel Paula
Purchase Details
Closed on
Apr 12, 2002
Sold by
Howard Roy A and Howard Lorraine
Bought by
Russel Paula
Create a Home Valuation Report for This Property
The Home Valuation Report is an in-depth analysis detailing your home's value as well as a comparison with similar homes in the area
Home Values in the Area
Average Home Value in this Area
Purchase History
| Date | Buyer | Sale Price | Title Company |
|---|---|---|---|
| Rocafuerte Henry R | -- | None Available | |
| Rocafuerte Henry R | -- | Chicago Title Company | |
| Swenson Steve | -- | Accommodation | |
| Hagan Investments Inc | $75,000 | Southland Title | |
| Russel Paula | $30,000 | New Century Title Company | |
| Russel Paula | $30,000 | New Century Title Company |
Source: Public Records
Mortgage History
| Date | Status | Borrower | Loan Amount |
|---|---|---|---|
| Previous Owner | Rocafuerte Henry R | $214,325 |
Source: Public Records
Tax History Compared to Growth
Tax History
| Year | Tax Paid | Tax Assessment Tax Assessment Total Assessment is a certain percentage of the fair market value that is determined by local assessors to be the total taxable value of land and additions on the property. | Land | Improvement |
|---|---|---|---|---|
| 2025 | $2,883 | $276,192 | $81,636 | $194,556 |
| 2023 | $2,883 | $265,469 | $78,467 | $187,002 |
| 2022 | $2,792 | $260,265 | $76,929 | $183,336 |
| 2021 | $2,739 | $255,163 | $75,421 | $179,742 |
| 2020 | $2,712 | $252,547 | $74,648 | $177,899 |
| 2019 | $2,661 | $247,596 | $73,185 | $174,411 |
| 2018 | $2,610 | $242,742 | $71,751 | $170,991 |
| 2017 | $2,561 | $237,984 | $70,345 | $167,639 |
| 2016 | $2,468 | $233,318 | $68,966 | $164,352 |
| 2015 | $2,435 | $229,815 | $67,931 | $161,884 |
| 2014 | $2,343 | $225,315 | $66,601 | $158,714 |
Source: Public Records
Map
Nearby Homes
- 0 Baum Unit SW25165889
- 0 Hill Ave E Unit IV25019850
- 0 Hill Ave E Unit SW24233820
- 30400 Morton Ave
- 30223 Morton Ave
- 0 Calkins Unit CV25223521
- 18271 Treleven Ave
- 0 Chaney St Unit OC24151853
- 221 Matich St
- 1205 W Pottery St
- 1 Palm
- 0 Palm Dr Unit SW25163852
- 0 Palm Dr Unit SW24231367
- 0 Palm Dr Unit SW24217455
- 0 Palm Dr Unit SW23095829
- 0 Heim Ave
- 313 Silver St
- 1006 W Pottery St
- 2 Ryan Ln
- 0 Mc Burney Ave Unit IV25136228
- 30216 Baum Ave
- 30200 Baum Ave
- 30209 Gutkaes Ave
- 30224 Baum Ave
- 30201 Gutkaes Ave
- 30348 Baum
- 016/011 Country Club Heights #23 Unit 12, 14A, 15
- 0 Gutkaes Ave Unit K12088347
- 320 Chaney St
- 30302 Gedge Ave
- 30302 Gedge Ave
- 0 Baum Unit IG18010914
- 0 Baum Unit I08034687
- 0 Baum Unit K08113675
- 0 Baum Unit T08135832
- 0 Baum Unit T09027866
- 0 Baum Unit T10018870
- 0 Baum Unit IG17231152
- 0 Baum Unit SW14002032
- 0 Baum Unit IG16068899