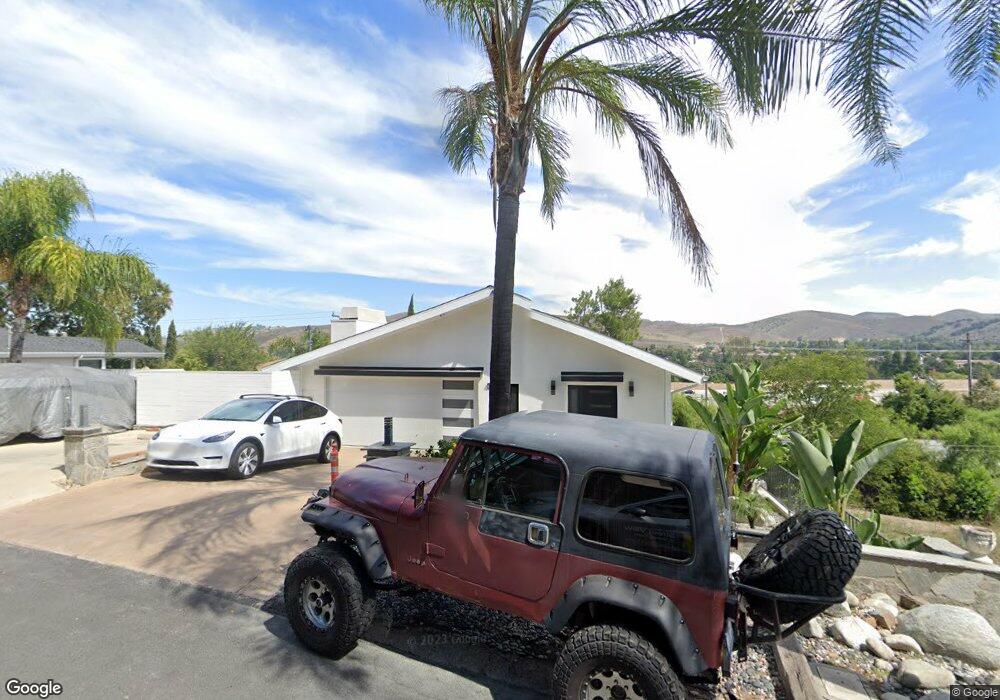
3021 Foothill Dr Thousand Oaks, CA 91361
Estimated Value: $1,128,542 - $1,452,000
4
Beds
4
Baths
2,672
Sq Ft
$456/Sq Ft
Est. Value
About This Home
This home is located at 3021 Foothill Dr, Thousand Oaks, CA 91361 and is currently estimated at $1,218,386, approximately $455 per square foot. 3021 Foothill Dr is a home located in Ventura County with nearby schools including Conejo Elementary School, Colina Middle School, and Westlake High School.
Ownership History
Date
Name
Owned For
Owner Type
Purchase Details
Closed on
Feb 10, 1997
Sold by
First Bank National Bank
Bought by
Moore Jeffrey and Moore Carina
Current Estimated Value
Home Financials for this Owner
Home Financials are based on the most recent Mortgage that was taken out on this home.
Original Mortgage
$199,500
Outstanding Balance
$23,064
Interest Rate
7.81%
Estimated Equity
$1,195,322
Purchase Details
Closed on
Apr 16, 1996
Sold by
Gibb Cary M and Gibb Dana L
Bought by
American Svgs Bank Fa and American Svgs Bank
Purchase Details
Closed on
Nov 30, 1994
Sold by
Moreno Gil and Moreno Geraldine
Bought by
Gibb Cary M
Home Financials for this Owner
Home Financials are based on the most recent Mortgage that was taken out on this home.
Original Mortgage
$50,000
Interest Rate
9.08%
Mortgage Type
Seller Take Back
Create a Home Valuation Report for This Property
The Home Valuation Report is an in-depth analysis detailing your home's value as well as a comparison with similar homes in the area
Home Values in the Area
Average Home Value in this Area
Purchase History
| Date | Buyer | Sale Price | Title Company |
|---|---|---|---|
| Moore Jeffrey | $210,500 | Investors Title Company | |
| First Bank National Bank | -- | Investors Title Company | |
| American Svgs Bank Fa | $265,586 | Old Republic Title Company | |
| Gibb Cary M | $50,000 | Lincoln Title Co |
Source: Public Records
Mortgage History
| Date | Status | Borrower | Loan Amount |
|---|---|---|---|
| Open | Moore Jeffrey | $199,500 | |
| Previous Owner | Gibb Cary M | $50,000 |
Source: Public Records
Tax History Compared to Growth
Tax History
| Year | Tax Paid | Tax Assessment Tax Assessment Total Assessment is a certain percentage of the fair market value that is determined by local assessors to be the total taxable value of land and additions on the property. | Land | Improvement |
|---|---|---|---|---|
| 2025 | $4,743 | $410,775 | $162,855 | $247,920 |
| 2024 | $4,743 | $402,721 | $159,662 | $243,059 |
| 2023 | $4,594 | $394,825 | $156,531 | $238,294 |
| 2022 | $4,512 | $387,084 | $153,462 | $233,622 |
| 2021 | $4,435 | $379,495 | $150,453 | $229,042 |
| 2020 | $4,024 | $375,606 | $148,911 | $226,695 |
| 2019 | $3,918 | $368,242 | $145,992 | $222,250 |
| 2018 | $3,840 | $361,023 | $143,130 | $217,893 |
| 2017 | $3,767 | $353,945 | $140,324 | $213,621 |
| 2016 | $3,732 | $347,006 | $137,573 | $209,433 |
| 2015 | $3,667 | $341,795 | $135,507 | $206,288 |
| 2014 | $3,616 | $335,102 | $132,853 | $202,249 |
Source: Public Records
Map
Nearby Homes
- 272 Manzanita Ln
- 107 Fairview Rd
- 0 S Skyline Dr Unit 25583591
- 0 S Skyline Dr Unit SR25094983
- 0 S Skyline Dr Unit PW24235911
- 3236 Royal Oaks Dr Unit 5
- 3349 Holly Grove St
- 3388 Holly Grove St
- 3414 Holly Grove St
- 112 Navajo Way Unit 48
- 198 N Skyline Dr Unit 64
- 198 N Skyline Dr Unit 52
- 2426 Pleasant Way Unit E
- 2450 Pleasant Way Unit J
- 2450 Pleasant Way Unit N
- 2462 Pleasant Way Unit J
- 2474 Pleasant Way Unit P
- 2394 Pleasant Way Unit J
- 1772 Tamarack St
- 3091 E Hillcrest Dr
- 0 Foothill Drive - Lot #6 Unit 213001592
- 0 Foothill Drive - Lot #6 Unit 214018101
- 0 Foothill Drive - Lot #6 Unit V0-213001592
- 0 Foothill Drive - Lot #6 Unit V0-214018101
- 0 Foothill Drive - Lot #6 Unit V0-214036530
- 3005 Foothill Dr
- 3012 Willow Ln
- 3034 Willow Ln
- 3004 Willow Ln
- 3058 Willow Ln
- 2971 Foothill Dr
- 2987 Willow Ln
- 2968 Willow Ln
- 3010 Foothill Dr Unit Lot 7
- 3010 Foothill Dr
- 231 Fairview Rd
- 265 Fairview Rd
- 287 Fairview Rd
- 2939 Foothill Dr
- 257 Fairview Rd