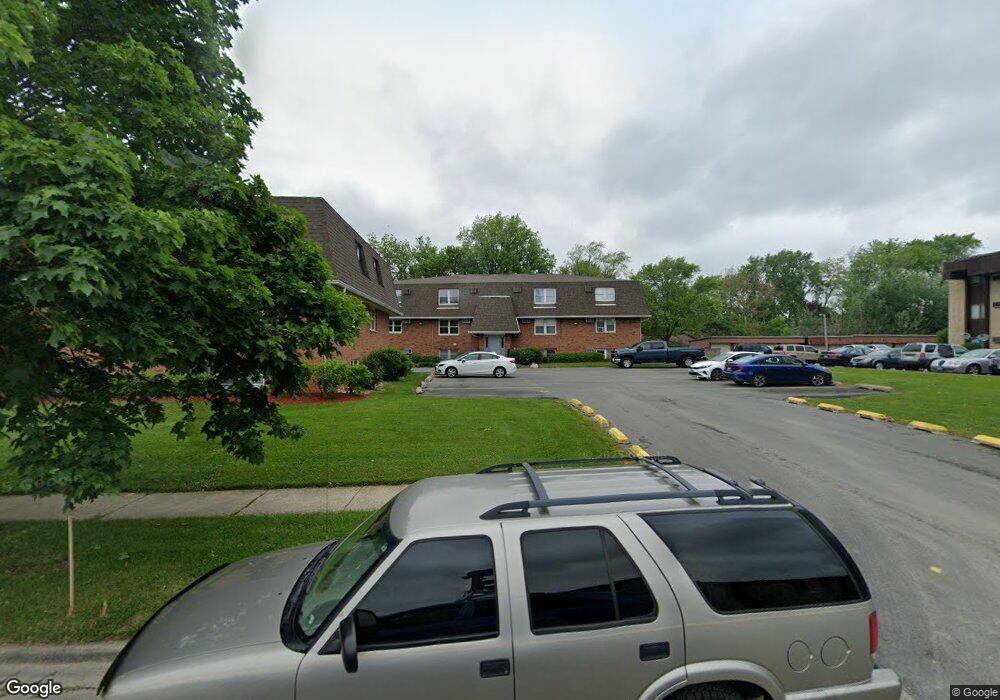
3021 Heritage Dr Unit 12 Joliet, IL 60435
Southwest Joliet NeighborhoodEstimated Value: $124,000 - $140,000
2
Beds
1
Bath
831
Sq Ft
$155/Sq Ft
Est. Value
About This Home
This home is located at 3021 Heritage Dr Unit 12, Joliet, IL 60435 and is currently estimated at $128,395, approximately $154 per square foot. 3021 Heritage Dr Unit 12 is a home located in Will County with nearby schools including Troy Craughwell Elementary School, Troy Middle School, and Orenic Intermediate School.
Ownership History
Date
Name
Owned For
Owner Type
Purchase Details
Closed on
May 14, 2003
Sold by
Jaksha Michael J
Bought by
Varela Eric E
Current Estimated Value
Home Financials for this Owner
Home Financials are based on the most recent Mortgage that was taken out on this home.
Original Mortgage
$51,300
Outstanding Balance
$25,197
Interest Rate
7.6%
Mortgage Type
Purchase Money Mortgage
Estimated Equity
$103,198
Purchase Details
Closed on
Sep 29, 1999
Sold by
Smith Lester R and Smith Judith A
Bought by
Pastore Jennifer H
Home Financials for this Owner
Home Financials are based on the most recent Mortgage that was taken out on this home.
Original Mortgage
$41,520
Interest Rate
7.83%
Mortgage Type
Purchase Money Mortgage
Purchase Details
Closed on
Sep 28, 1995
Sold by
Costlow Patricia S and Madonis Patricia S
Bought by
Madonis John
Purchase Details
Closed on
Feb 24, 1994
Sold by
Holman Benjamin C
Bought by
Holman Benjamin and Holman Claudia R
Create a Home Valuation Report for This Property
The Home Valuation Report is an in-depth analysis detailing your home's value as well as a comparison with similar homes in the area
Home Values in the Area
Average Home Value in this Area
Purchase History
| Date | Buyer | Sale Price | Title Company |
|---|---|---|---|
| Varela Eric E | $57,000 | Ticor | |
| Pastore Jennifer H | $52,000 | -- | |
| Madonis John | -- | -- | |
| Holman Benjamin | -- | -- |
Source: Public Records
Mortgage History
| Date | Status | Borrower | Loan Amount |
|---|---|---|---|
| Open | Varela Eric E | $51,300 | |
| Previous Owner | Pastore Jennifer H | $41,520 |
Source: Public Records
Tax History Compared to Growth
Tax History
| Year | Tax Paid | Tax Assessment Tax Assessment Total Assessment is a certain percentage of the fair market value that is determined by local assessors to be the total taxable value of land and additions on the property. | Land | Improvement |
|---|---|---|---|---|
| 2024 | $2,704 | $30,798 | $4,893 | $25,905 |
| 2023 | $2,704 | $26,354 | $4,396 | $21,958 |
| 2022 | $2,315 | $24,938 | $4,160 | $20,778 |
| 2021 | $2,180 | $23,460 | $3,913 | $19,547 |
| 2020 | $2,183 | $23,460 | $3,913 | $19,547 |
| 2019 | $2,124 | $22,503 | $3,753 | $18,750 |
| 2018 | $2,101 | $21,603 | $3,753 | $17,850 |
| 2017 | $2,072 | $20,897 | $3,753 | $17,144 |
| 2016 | $2,007 | $19,515 | $3,753 | $15,762 |
| 2015 | $1,965 | $18,553 | $3,753 | $14,800 |
| 2014 | $1,965 | $18,600 | $3,753 | $14,847 |
| 2013 | $1,965 | $18,600 | $3,753 | $14,847 |
Source: Public Records
Map
Nearby Homes
- 3001 Heritage Dr Unit 208
- 2891 Heritage Dr Unit 1A
- 2891 Heritage Dr Unit 3A
- 3206 Jeffrey Dr
- 207 Meadow Wood Dr
- 123 Fairlane Dr
- 3318 Indianwood Ln
- 378 Brink Dr
- 180 Barbara Jean Ln Unit D
- 197 Barbara Jean Ln Unit 4
- 181 Saenz Ln Unit A22
- 410 Rollingwood Ln Unit 1
- 206 Stephen Ln
- 2602 Fairway Dr
- 2604 Caddy Ln
- 2632 Crescenzo Dr
- 509 Apollo Dr
- 2602 Glenwood Ave
- 601 Fairlane Dr
- 710 Sanctuary Ln
- 3021 Heritage Dr
- 3021 Heritage Dr Unit 11
- 3021 Heritage Dr Unit DR5
- 3021 Heritage Dr Unit DR7
- 3021 Heritage Dr Unit DR2
- 3021 Heritage Dr Unit 10
- 3021 Heritage Dr Unit DR1
- 3021 Heritage Dr Unit DR4
- 3021 Heritage Dr Unit DR9
- 3021 Heritage Dr Unit DR6
- 3021 Heritage Dr Unit DR8
- 3021 Heritage Dr Unit 3
- 3021 Heritage Dr Unit 2
- 3101 W Heritage Dr Unit 10
- 3101 W Heritage Dr Unit 5
- 3101 Heritage Dr Unit 11
- 3101 Heritage Dr Unit 8
- 3101 Heritage Dr Unit 2
- 3101 Heritage Dr Unit 7
- 3101 Heritage Dr Unit 10