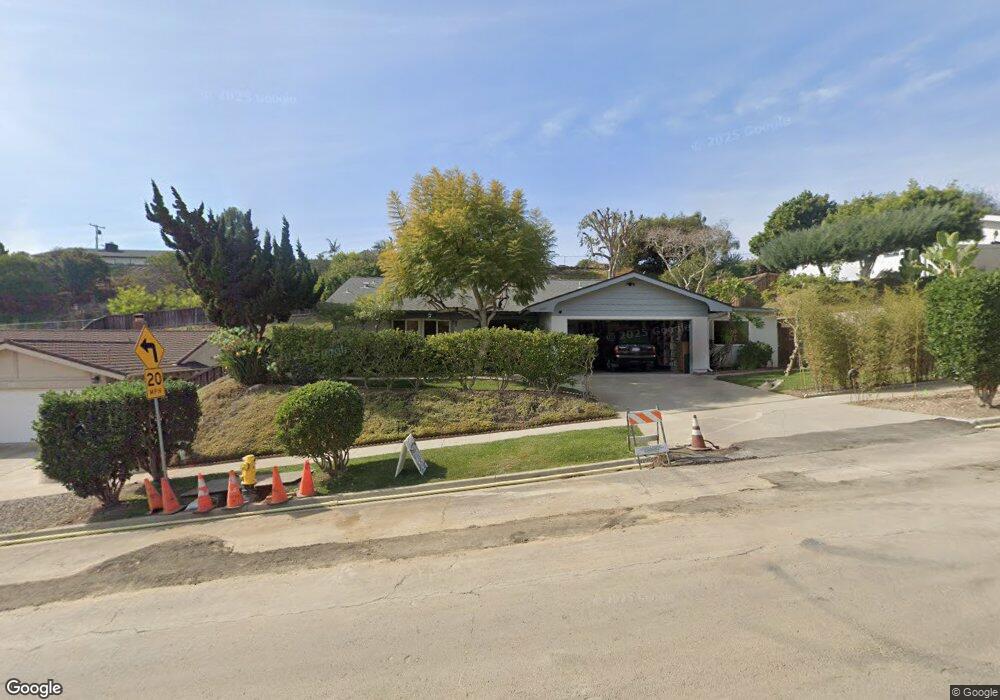
3021 Pennant Way San Diego, CA 92122
University City NeighborhoodEstimated Value: $1,588,781 - $1,796,000
4
Beds
2
Baths
1,962
Sq Ft
$861/Sq Ft
Est. Value
About This Home
This home is located at 3021 Pennant Way, San Diego, CA 92122 and is currently estimated at $1,688,445, approximately $860 per square foot. 3021 Pennant Way is a home located in San Diego County with nearby schools including Spreckels Elementary School, Standley Middle School, and University City High School.
Ownership History
Date
Name
Owned For
Owner Type
Purchase Details
Closed on
Aug 30, 2024
Sold by
Calderon Carlos Alberto and Calderon Carolyn Bubela
Bought by
Calderon Revocable Trust and Calderon
Current Estimated Value
Purchase Details
Closed on
Feb 6, 2018
Sold by
Calderon Carlos A and Calderon Carolyn B
Bought by
Calderon Carolyn B and Calderon Carlos A
Home Financials for this Owner
Home Financials are based on the most recent Mortgage that was taken out on this home.
Original Mortgage
$385,000
Interest Rate
3.99%
Mortgage Type
New Conventional
Purchase Details
Closed on
Oct 7, 1997
Sold by
Calderon Carlos A
Bought by
Calderon Carlos Alberto and Calderon Carolyn B
Home Financials for this Owner
Home Financials are based on the most recent Mortgage that was taken out on this home.
Original Mortgage
$73,600
Interest Rate
7.44%
Mortgage Type
Credit Line Revolving
Create a Home Valuation Report for This Property
The Home Valuation Report is an in-depth analysis detailing your home's value as well as a comparison with similar homes in the area
Home Values in the Area
Average Home Value in this Area
Purchase History
| Date | Buyer | Sale Price | Title Company |
|---|---|---|---|
| Calderon Revocable Trust | -- | None Listed On Document | |
| Calderon Carlos Alberto | -- | None Listed On Document | |
| Calderon Carolyn B | -- | Nextitle | |
| Calderon Carlos Alberto | -- | Chicago Title Co |
Source: Public Records
Mortgage History
| Date | Status | Borrower | Loan Amount |
|---|---|---|---|
| Previous Owner | Calderon Carolyn B | $385,000 | |
| Previous Owner | Calderon Carlos Alberto | $73,600 |
Source: Public Records
Tax History Compared to Growth
Tax History
| Year | Tax Paid | Tax Assessment Tax Assessment Total Assessment is a certain percentage of the fair market value that is determined by local assessors to be the total taxable value of land and additions on the property. | Land | Improvement |
|---|---|---|---|---|
| 2025 | $4,290 | $360,524 | $198,601 | $161,923 |
| 2024 | $4,290 | $353,456 | $194,707 | $158,749 |
| 2023 | $4,193 | $346,527 | $190,890 | $155,637 |
| 2022 | $4,080 | $339,734 | $187,148 | $152,586 |
| 2021 | $4,051 | $333,074 | $183,479 | $149,595 |
| 2020 | $4,001 | $329,660 | $181,598 | $148,062 |
| 2019 | $3,928 | $323,197 | $178,038 | $145,159 |
| 2018 | $3,672 | $316,861 | $174,548 | $142,313 |
| 2017 | $3,583 | $310,649 | $171,126 | $139,523 |
| 2016 | $3,524 | $304,559 | $167,771 | $136,788 |
| 2015 | $3,471 | $299,985 | $165,251 | $134,734 |
| 2014 | $3,415 | $294,109 | $162,014 | $132,095 |
Source: Public Records
Map
Nearby Homes
- 2925 Fried Ave
- 3003 Fried Ave
- 5864 Lamas St
- 6036 Tulane St
- 5822 Stadium St
- 2712 Angell Ave
- 3542 Governor Dr
- 5522 Bloch St
- 4085 Rosenda Ct Unit 259
- 4095 Rosenda Ct Unit 249
- 3598 Syracuse Ave
- 5249 Gaylord Place
- 8037 Caminito Mallorca
- 8280 Caminito Sonoma
- 3941 Camino Lindo
- 3965 Camino Lindo Unit 194
- 4786 Monongahela St
- 8340 Via Sonoma Unit F
- 4145 Porte de Merano Unit 128
- 6614 Dennison St
- 3031 Pennant Way
- 3011 Pennant Way
- 5661 Sandburg Ave
- 5783 Honors Dr
- 3041 Pennant Way
- 5647 Sandburg Ave
- 5797 Honors Dr
- 5673 Sandburg Ave
- 5633 Sandburg Ave
- 3057 Award Row
- 3069 Award Row
- 3051 Pennant Way
- 5805 Honors Dr
- 5619 Sandburg Ave
- 3031 Award Row
- 5654 Sandburg Ave
- 3015 Award Row
- 5668 Sandburg Ave
- 5784 Honors Dr
- 5640 Sandburg Ave