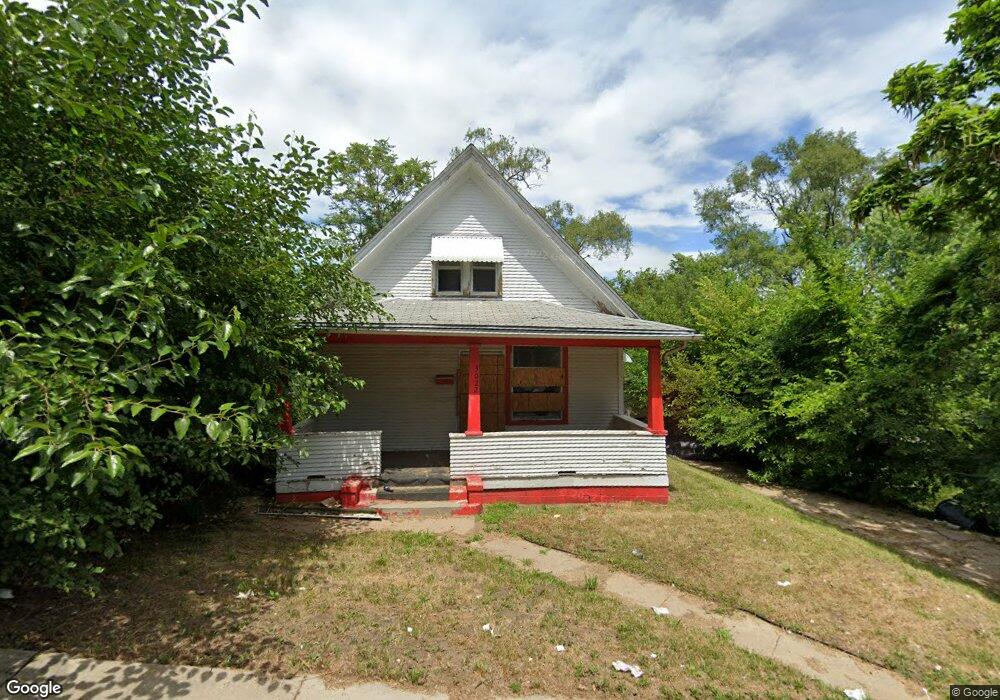
3022 Corby St Omaha, NE 68111
Erskine Park NeighborhoodEstimated Value: $90,000 - $176,000
3
Beds
3
Baths
1,167
Sq Ft
$111/Sq Ft
Est. Value
About This Home
This home is located at 3022 Corby St, Omaha, NE 68111 and is currently estimated at $129,649, approximately $111 per square foot. 3022 Corby St is a home located in Douglas County with nearby schools including Kennedy Elementary School, Monroe Middle School, and Benson Magnet High School.
Ownership History
Date
Name
Owned For
Owner Type
Purchase Details
Closed on
Oct 16, 2023
Sold by
Omaha Municipal Land Bank
Bought by
Seventy Five North Revitalization Corp
Current Estimated Value
Purchase Details
Closed on
Jun 28, 2017
Sold by
Seventy Five North Revitalizqation Corp
Bought by
Omaha Municipal Land Bank
Purchase Details
Closed on
Sep 8, 2016
Sold by
Chapman Die3hl Co Ii
Bought by
Seventu Five N Revitalization Corp
Purchase Details
Closed on
Jun 30, 2003
Sold by
Gray Annabelle and Gray Keith William
Bought by
Chapman Dichl Co Ii
Create a Home Valuation Report for This Property
The Home Valuation Report is an in-depth analysis detailing your home's value as well as a comparison with similar homes in the area
Home Values in the Area
Average Home Value in this Area
Purchase History
| Date | Buyer | Sale Price | Title Company |
|---|---|---|---|
| Seventy Five North Revitalization Corp | -- | None Listed On Document | |
| Omaha Municipal Land Bank | -- | None Available | |
| Seventu Five N Revitalization Corp | $42,000 | None Available | |
| Chapman Dichl Co Ii | $17,000 | -- |
Source: Public Records
Tax History Compared to Growth
Tax History
| Year | Tax Paid | Tax Assessment Tax Assessment Total Assessment is a certain percentage of the fair market value that is determined by local assessors to be the total taxable value of land and additions on the property. | Land | Improvement |
|---|---|---|---|---|
| 2024 | -- | $17,400 | $17,400 | -- |
| 2023 | -- | -- | -- | -- |
| 2022 | $0 | $0 | $0 | $0 |
| 2021 | $0 | $0 | $0 | $0 |
| 2020 | $0 | $0 | $0 | $0 |
| 2019 | $979 | $0 | $0 | $0 |
| 2018 | $0 | $0 | $0 | $0 |
| 2017 | $979 | $34,600 | $900 | $33,700 |
| 2016 | $979 | $45,600 | $800 | $44,800 |
| 2015 | $749 | $35,400 | $3,200 | $32,200 |
| 2014 | $749 | $35,400 | $3,200 | $32,200 |
Source: Public Records
Map
Nearby Homes