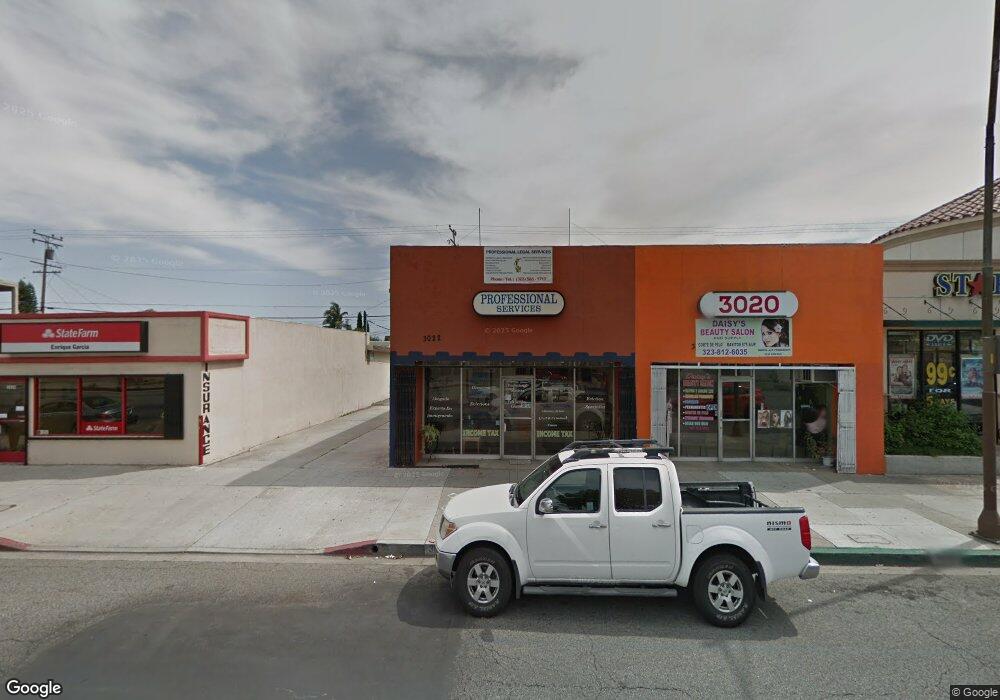
3022 E Florence Ave Huntington Park, CA 90255
Estimated Value: $816,499
--
Bed
--
Bath
2,610
Sq Ft
$313/Sq Ft
Est. Value
About This Home
This home is located at 3022 E Florence Ave, Huntington Park, CA 90255 and is currently estimated at $816,499, approximately $312 per square foot. 3022 E Florence Ave is a home located in Los Angeles County with nearby schools including Lucille Roybal-Allard Elementary, Henry T. Gage Middle School, and Huntington Park Senior High School.
Ownership History
Date
Name
Owned For
Owner Type
Purchase Details
Closed on
Mar 3, 2016
Sold by
Flores Abigail
Bought by
Flores Abigail and The Abigail Flores Revocable L
Current Estimated Value
Purchase Details
Closed on
Mar 1, 2007
Sold by
Flores Abigail and Vargas Abigail
Bought by
Flores Abigail
Home Financials for this Owner
Home Financials are based on the most recent Mortgage that was taken out on this home.
Original Mortgage
$250,000
Outstanding Balance
$151,570
Interest Rate
6.29%
Mortgage Type
Commercial
Estimated Equity
$664,929
Purchase Details
Closed on
Dec 28, 1994
Sold by
Beltran Frank J and Beltran Carmen
Bought by
Vargas Abigail
Home Financials for this Owner
Home Financials are based on the most recent Mortgage that was taken out on this home.
Original Mortgage
$93,600
Interest Rate
12%
Purchase Details
Closed on
Oct 20, 1994
Sold by
Beltran Frank J and Beltran Carmen
Bought by
Beltran Investments Ltd
Create a Home Valuation Report for This Property
The Home Valuation Report is an in-depth analysis detailing your home's value as well as a comparison with similar homes in the area
Home Values in the Area
Average Home Value in this Area
Purchase History
| Date | Buyer | Sale Price | Title Company |
|---|---|---|---|
| Flores Abigail | -- | None Available | |
| Flores Abigail | -- | First American Title Co | |
| Vargas Abigail | $200,000 | Continental Lawyers Title Co | |
| Beltran Investments Ltd | -- | -- |
Source: Public Records
Mortgage History
| Date | Status | Borrower | Loan Amount |
|---|---|---|---|
| Open | Flores Abigail | $250,000 | |
| Closed | Vargas Abigail | $93,600 | |
| Closed | Vargas Abigail | $46,400 |
Source: Public Records
Tax History Compared to Growth
Tax History
| Year | Tax Paid | Tax Assessment Tax Assessment Total Assessment is a certain percentage of the fair market value that is determined by local assessors to be the total taxable value of land and additions on the property. | Land | Improvement |
|---|---|---|---|---|
| 2025 | $6,046 | $335,907 | $157,875 | $178,032 |
| 2024 | $6,046 | $329,322 | $154,780 | $174,542 |
| 2023 | $5,937 | $322,866 | $151,746 | $171,120 |
| 2022 | $5,696 | $316,536 | $148,771 | $167,765 |
| 2021 | $5,603 | $310,330 | $145,854 | $164,476 |
| 2019 | $5,479 | $301,128 | $141,529 | $159,599 |
| 2018 | $5,225 | $295,224 | $138,754 | $156,470 |
| 2016 | $5,052 | $283,762 | $133,367 | $150,395 |
| 2015 | $4,882 | $279,500 | $131,364 | $148,136 |
| 2014 | $4,856 | $274,026 | $128,791 | $145,235 |
Source: Public Records
Map
Nearby Homes
- 3007 Flower St
- 2930 Live Oak St
- 2829 California St
- 6913 Plaska Ave
- 2749 Live Oak St
- 3245 Live Oak St
- 7015 Templeton St
- 7126 Stafford Ave
- 6900 Templeton St
- 2712 California St
- 3107 Hill St
- 3152 Olive St
- 7223 Seville Ave
- 2912 Hill St
- 2742 Olive St
- 3037 Cudahy St
- 7018 Rita Ave Unit 206
- 7018 Rita Ave Unit 404
- 6815 Seville Ave
- 6356 Marconi St
- 3023 Walnut St
- 3019 Walnut St
- 3027 Walnut St
- 3034 E Florence Ave
- 3031 Walnut St
- 3013 Walnut St
- 3035 Walnut St
- 3007 Walnut St
- 3041 Walnut St
- 3003 Walnut St
- 3076 E Florence Ave
- 3045 Walnut St
- 3053 E Florence Ave
- 2979 Walnut St
- 7129 Arbutus Ave
- 3020 Walnut St
- 3018 Walnut St
- 3028 Walnut St
- 7130 Arbutus Ave
- 3049 Walnut St