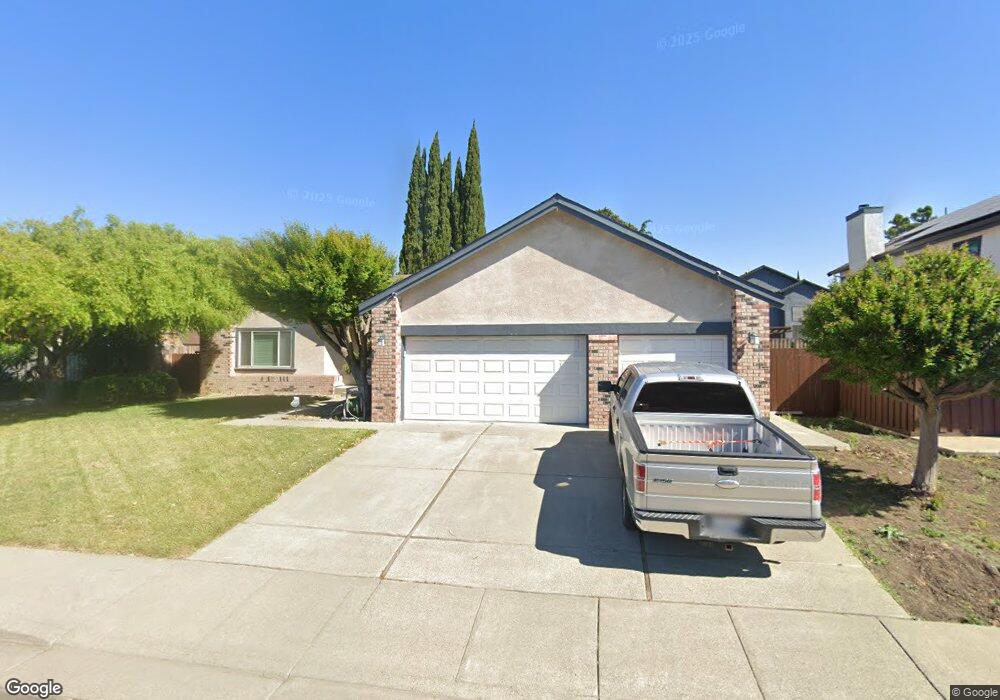
3022 Pecan Cir Fairfield, CA 94533
Estimated Value: $568,000 - $656,000
4
Beds
2
Baths
1,947
Sq Ft
$308/Sq Ft
Est. Value
About This Home
This home is located at 3022 Pecan Cir, Fairfield, CA 94533 and is currently estimated at $600,534, approximately $308 per square foot. 3022 Pecan Cir is a home located in Solano County with nearby schools including Laurel Creek Elementary School, Grange Middle School, and Fairfield High School.
Ownership History
Date
Name
Owned For
Owner Type
Purchase Details
Closed on
Dec 8, 2020
Sold by
Allen John W and Allen Suzanne M
Bought by
Allen John and Allen Suzanne
Current Estimated Value
Home Financials for this Owner
Home Financials are based on the most recent Mortgage that was taken out on this home.
Original Mortgage
$411,000
Outstanding Balance
$366,565
Interest Rate
2.8%
Mortgage Type
New Conventional
Estimated Equity
$233,969
Purchase Details
Closed on
May 27, 2016
Sold by
Allen John and Allen Suzanne
Bought by
The Suzanne & John Allen Living Trust and Allen John
Purchase Details
Closed on
Sep 27, 2001
Sold by
Puskas Dale G and Puskas Rene
Bought by
Allen John and Allen Suzanne
Home Financials for this Owner
Home Financials are based on the most recent Mortgage that was taken out on this home.
Original Mortgage
$228,000
Interest Rate
6.9%
Create a Home Valuation Report for This Property
The Home Valuation Report is an in-depth analysis detailing your home's value as well as a comparison with similar homes in the area
Home Values in the Area
Average Home Value in this Area
Purchase History
| Date | Buyer | Sale Price | Title Company |
|---|---|---|---|
| Allen John | -- | Old Republic Title Company | |
| Allen John W | -- | Old Republic Title Company | |
| The Suzanne & John Allen Living Trust | -- | None Available | |
| Allen John | $285,000 | First American Title Guarant |
Source: Public Records
Mortgage History
| Date | Status | Borrower | Loan Amount |
|---|---|---|---|
| Open | Allen John W | $411,000 | |
| Closed | Allen John | $228,000 |
Source: Public Records
Tax History Compared to Growth
Tax History
| Year | Tax Paid | Tax Assessment Tax Assessment Total Assessment is a certain percentage of the fair market value that is determined by local assessors to be the total taxable value of land and additions on the property. | Land | Improvement |
|---|---|---|---|---|
| 2025 | $4,628 | $421,020 | $96,018 | $325,002 |
| 2024 | $4,628 | $412,766 | $94,136 | $318,630 |
| 2023 | $4,484 | $404,674 | $92,291 | $312,383 |
| 2022 | $4,428 | $396,740 | $90,482 | $306,258 |
| 2021 | $4,383 | $388,961 | $88,708 | $300,253 |
| 2020 | $4,279 | $384,974 | $87,799 | $297,175 |
| 2019 | $4,172 | $377,427 | $86,078 | $291,349 |
| 2018 | $4,306 | $370,028 | $84,391 | $285,637 |
| 2017 | $4,105 | $362,774 | $82,737 | $280,037 |
| 2016 | $3,891 | $340,000 | $57,000 | $283,000 |
| 2015 | $3,511 | $324,000 | $58,000 | $266,000 |
| 2014 | $3,526 | $322,000 | $61,000 | $261,000 |
Source: Public Records
Map
Nearby Homes
- 3087 Pecan Cir
- 2924 Redwood Dr
- 3015 Redwood Dr
- 1031 Suffolk Way
- 727 Shamrock Ct
- 743 Isabella Way
- 722 Rosemary Ct
- 3233 Lagunita Cir
- 3283 Lagunita Cir
- 3101 Arroyo Ct
- 703 Mustang Ct
- 675 Hillside Dr
- Arlo Plan at Villages at Fairfield - Summerwalk at the Villages
- Bennett Plan at Villages at Fairfield - Summerwalk at the Villages
- Carson Plan at Villages at Fairfield - Summerwalk at the Villages
- Darby Plan at Villages at Fairfield - Summerwalk at the Villages
- 738 Marsh Place
- 2859 Elmhurst Cir
- 1031 Valley Oak Way
- 1039 Valley Oak Way