Estimated Value: $295,709
Studio
--
Bath
4,648
Sq Ft
$64/Sq Ft
Est. Value
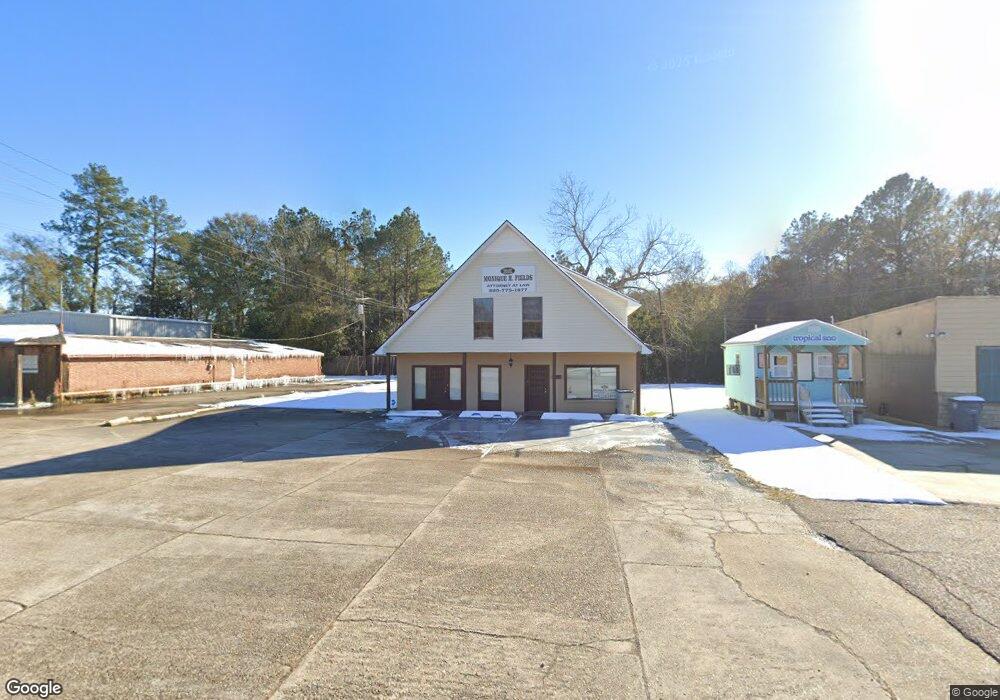
About This Home
This home is located at 3022 Ray Weiland Dr, Baker, LA 70714 and is currently estimated at $295,709, approximately $63 per square foot. 3022 Ray Weiland Dr is a home located in East Baton Rouge Parish with nearby schools including Baker Heights Elementary School, Baker Middle School, and Baker High School.
Ownership History
Date
Name
Owned For
Owner Type
Purchase Details
Closed on
Oct 1, 2025
Sold by
Fields Monique L
Bought by
Jg 11
Current Estimated Value
Purchase Details
Closed on
May 24, 2016
Sold by
Doyne David M and Doyne Yumiko
Bought by
Fields Monique L
Home Financials for this Owner
Home Financials are based on the most recent Mortgage that was taken out on this home.
Original Mortgage
$138,750
Outstanding Balance
$110,166
Interest Rate
3.58%
Mortgage Type
Future Advance Clause Open End Mortgage
Estimated Equity
$185,543
Purchase Details
Closed on
Jun 12, 2006
Sold by
Plaisance Mark D
Bought by
Doyne David M
Purchase Details
Closed on
Dec 28, 2000
Sold by
Thompson Paul T and Thompson Freida Herren
Bought by
Plaisance Mark D and Plaisance Desley V
Home Financials for this Owner
Home Financials are based on the most recent Mortgage that was taken out on this home.
Original Mortgage
$80,000
Interest Rate
7.73%
Mortgage Type
Commercial
Create a Home Valuation Report for This Property
The Home Valuation Report is an in-depth analysis detailing your home's value as well as a comparison with similar homes in the area
Home Values in the Area
Average Home Value in this Area
Purchase History
| Date | Buyer | Sale Price | Title Company |
|---|---|---|---|
| Jg 11 | -- | -- | |
| Fields Monique L | $185,000 | Attorney | |
| Doyne David M | $187,000 | -- | |
| Plaisance Mark D | $85,000 | -- |
Source: Public Records
Mortgage History
| Date | Status | Borrower | Loan Amount |
|---|---|---|---|
| Open | Fields Monique L | $138,750 | |
| Previous Owner | Plaisance Mark D | $80,000 | |
| Closed | Plaisance Mark D | $17,000 |
Source: Public Records
Tax History
| Year | Tax Paid | Tax Assessment Tax Assessment Total Assessment is a certain percentage of the fair market value that is determined by local assessors to be the total taxable value of land and additions on the property. | Land | Improvement |
|---|---|---|---|---|
| 2024 | $2,299 | $20,966 | $1,133 | $19,833 |
| 2023 | $2,215 | $19,060 | $1,030 | $18,030 |
| 2022 | $2,140 | $19,060 | $1,030 | $18,030 |
| 2021 | $2,121 | $19,060 | $1,030 | $18,030 |
| 2020 | $2,149 | $19,060 | $1,030 | $18,030 |
| 2019 | $2,157 | $18,500 | $1,000 | $17,500 |
| 2018 | $2,129 | $18,500 | $1,000 | $17,500 |
| 2017 | $2,129 | $18,500 | $1,000 | $17,500 |
| 2016 | $2,097 | $18,700 | $750 | $17,950 |
| 2015 | $2,096 | $18,700 | $750 | $17,950 |
| 2014 | $2,088 | $18,700 | $750 | $17,950 |
| 2013 | -- | $18,700 | $750 | $17,950 |
Source: Public Records
Map
Nearby Homes
- 1339 Louisiana Ave
- 600 Ray Weiland Dr
- 1428 Texas Ave Unit A &B
- 3280 Adams St
- 1068 Epperson St
- 2540 Groom Rd
- 2465 Ray Weiland Dr
- 2544 N Day Dr
- 419 Cypress Dr
- 403 Cypress Dr
- 3639 Groom Rd
- 3220 Jackson St
- 3501 Jefferson St
- 2188 Groom Rd
- 2706 S Magnolia Dr
- 3512 Charry Dr
- TBD Baker Blvd
- 4502 Fausse Dr
- 4406 Fourchon Dr
- 1903 Carolyn Dr
- 3012 Ray Weiland Dr
- 3430 Harrison
- 2950 Ray Weiland Dr
- 3040 Ray Weiland Dr
- LOT 15 Truman St
- 0 Truman St
- 15 Truman St
- 2929 Ray Weiland Dr
- 988 Main St
- 972 Main St
- 1006 Main St
- 960 La Hwy 19
- 960 Main St
- 2860 Ray Weiland Dr Unit 1
- 2860 Ray Weiland Dr
- 3115 Truman St
- 2845 Ray Weiland Dr
- 2842 Ray Weiland Dr
- 920 Main St
- 0 Louisiana 19
Your Personal Tour Guide
Ask me questions while you tour the home.