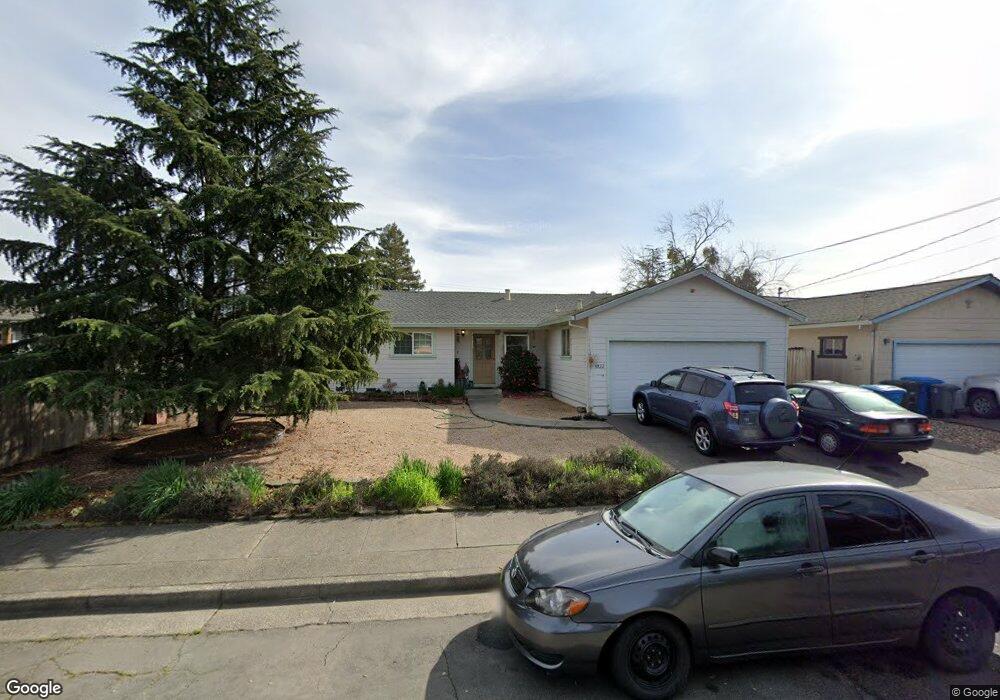
3022 Shasta Way Santa Rosa, CA 95403
Northwest Santa Rosa NeighborhoodEstimated Value: $540,013 - $637,000
3
Beds
2
Baths
1,155
Sq Ft
$519/Sq Ft
Est. Value
About This Home
This home is located at 3022 Shasta Way, Santa Rosa, CA 95403 and is currently estimated at $599,003, approximately $518 per square foot. 3022 Shasta Way is a home located in Sonoma County with nearby schools including Hidden Valley Elementary School, Hilliard Comstock Middle School, and Santa Rosa High School.
Ownership History
Date
Name
Owned For
Owner Type
Purchase Details
Closed on
May 8, 2019
Sold by
Suiter Kris L
Bought by
Suiter Kris L and Durham Suiter Sandy R
Current Estimated Value
Purchase Details
Closed on
Jul 15, 1997
Sold by
Suiter Kris L
Bought by
Suiter Kris L
Home Financials for this Owner
Home Financials are based on the most recent Mortgage that was taken out on this home.
Original Mortgage
$116,500
Outstanding Balance
$17,185
Interest Rate
7.83%
Estimated Equity
$581,818
Purchase Details
Closed on
Jun 25, 1997
Sold by
Suiter Wendy A and Suiter Wendy A
Bought by
Suiter Kris L
Home Financials for this Owner
Home Financials are based on the most recent Mortgage that was taken out on this home.
Original Mortgage
$116,500
Outstanding Balance
$17,185
Interest Rate
7.83%
Estimated Equity
$581,818
Purchase Details
Closed on
Apr 5, 1991
Bought by
Suiter Kris L
Create a Home Valuation Report for This Property
The Home Valuation Report is an in-depth analysis detailing your home's value as well as a comparison with similar homes in the area
Home Values in the Area
Average Home Value in this Area
Purchase History
| Date | Buyer | Sale Price | Title Company |
|---|---|---|---|
| Suiter Kris L | -- | None Available | |
| Suiter Kris L | -- | North Bay Title Co | |
| Suiter Kris L | -- | -- | |
| Suiter Kris L | $148,000 | -- |
Source: Public Records
Mortgage History
| Date | Status | Borrower | Loan Amount |
|---|---|---|---|
| Open | Suiter Kris L | $116,500 |
Source: Public Records
Tax History Compared to Growth
Tax History
| Year | Tax Paid | Tax Assessment Tax Assessment Total Assessment is a certain percentage of the fair market value that is determined by local assessors to be the total taxable value of land and additions on the property. | Land | Improvement |
|---|---|---|---|---|
| 2025 | $3,038 | $266,930 | $126,247 | $140,683 |
| 2024 | $3,038 | $261,697 | $123,772 | $137,925 |
| 2023 | $3,038 | $256,567 | $121,346 | $135,221 |
| 2022 | $2,807 | $251,537 | $118,967 | $132,570 |
| 2021 | $2,773 | $246,606 | $116,635 | $129,971 |
| 2020 | $2,767 | $244,079 | $115,440 | $128,639 |
| 2019 | $2,752 | $239,294 | $113,177 | $126,117 |
| 2018 | $2,737 | $234,603 | $110,958 | $123,645 |
| 2017 | $2,688 | $230,004 | $108,783 | $121,221 |
| 2016 | $2,663 | $225,495 | $106,650 | $118,845 |
| 2015 | $2,585 | $222,109 | $105,049 | $117,060 |
| 2014 | $2,428 | $217,759 | $102,992 | $114,767 |
Source: Public Records
Map
Nearby Homes
- 901 Russell Ave Unit 238
- 0 Russell Ave
- 3127 Clare Ave
- 4 Estrella Dr
- 817 Mercie St
- 816 Mary St
- 90 Estrella Dr
- 85 Estrella Dr
- 2595 Hardies Ln
- 2791 Mcbride Ln Unit 176
- 1795 Walnut Creek Dr
- 3593 Banyan St
- 2829 Apple Valley Ln
- 2147 W Steele Ln
- 3393 Lake Park Ct
- 1890 Dorado Ct
- 235 Gambrel Cir
- 2478 Plata Ct
- 2618 Plata Ct
- 1945 Piner Rd Unit 16