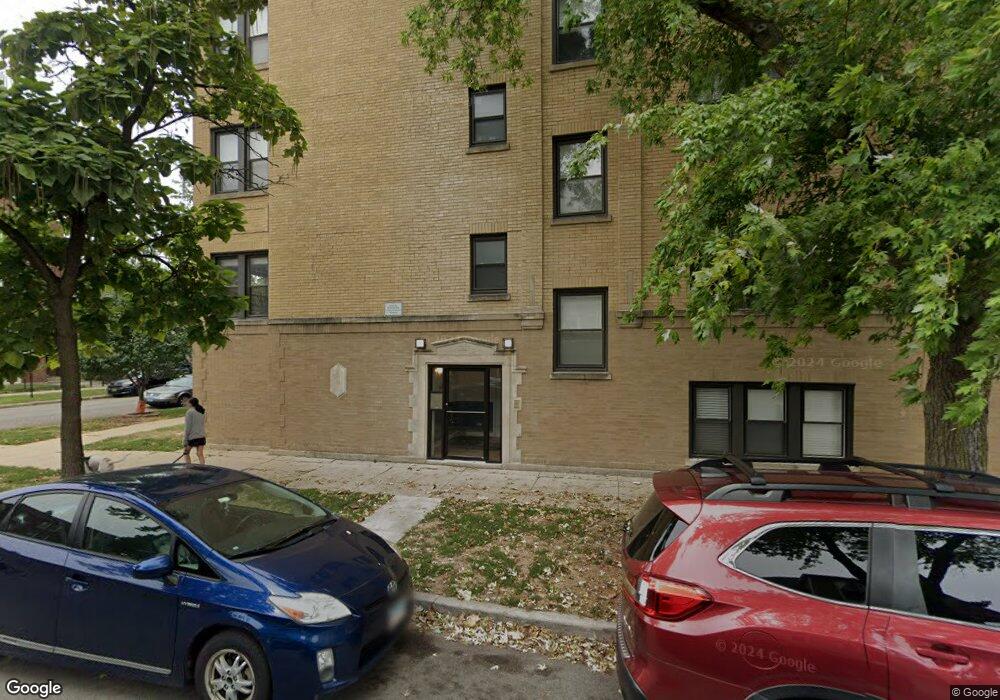
3022 W Belle Plaine Ave Unit 30 Chicago, IL 60618
Irving Park NeighborhoodEstimated Value: $265,443 - $352,000
2
Beds
1
Bath
950
Sq Ft
$306/Sq Ft
Est. Value
About This Home
This home is located at 3022 W Belle Plaine Ave Unit 30, Chicago, IL 60618 and is currently estimated at $291,111, approximately $306 per square foot. 3022 W Belle Plaine Ave Unit 30 is a home located in Cook County with nearby schools including Bateman Elementary School, Roosevelt High School, and CICS Irving Park.
Ownership History
Date
Name
Owned For
Owner Type
Purchase Details
Closed on
Aug 5, 2023
Sold by
Phillips Ian
Bought by
Davis Mitchell Ross
Current Estimated Value
Home Financials for this Owner
Home Financials are based on the most recent Mortgage that was taken out on this home.
Original Mortgage
$194,000
Outstanding Balance
$189,725
Interest Rate
6.99%
Mortgage Type
New Conventional
Estimated Equity
$101,386
Purchase Details
Closed on
Mar 15, 2016
Sold by
Keough Colleen T and Rogers Phillip
Bought by
Phillips Ian
Purchase Details
Closed on
Jan 11, 2007
Sold by
3016 W Belle Plaine Llc
Bought by
Keough Colleen T
Home Financials for this Owner
Home Financials are based on the most recent Mortgage that was taken out on this home.
Original Mortgage
$185,000
Interest Rate
6.21%
Mortgage Type
Purchase Money Mortgage
Create a Home Valuation Report for This Property
The Home Valuation Report is an in-depth analysis detailing your home's value as well as a comparison with similar homes in the area
Home Values in the Area
Average Home Value in this Area
Purchase History
| Date | Buyer | Sale Price | Title Company |
|---|---|---|---|
| Davis Mitchell Ross | $242,500 | None Listed On Document | |
| Phillips Ian | $165,000 | Chicago Title Insurance Co | |
| Keough Colleen T | $215,500 | Attorneys Title Guaranty Fun |
Source: Public Records
Mortgage History
| Date | Status | Borrower | Loan Amount |
|---|---|---|---|
| Open | Davis Mitchell Ross | $194,000 | |
| Previous Owner | Keough Colleen T | $185,000 |
Source: Public Records
Tax History Compared to Growth
Tax History
| Year | Tax Paid | Tax Assessment Tax Assessment Total Assessment is a certain percentage of the fair market value that is determined by local assessors to be the total taxable value of land and additions on the property. | Land | Improvement |
|---|---|---|---|---|
| 2024 | $2,358 | $20,180 | $1,874 | $18,306 |
| 2023 | $2,277 | $14,450 | $1,511 | $12,939 |
| 2022 | $2,277 | $14,450 | $1,511 | $12,939 |
| 2021 | $2,243 | $14,450 | $1,511 | $12,939 |
| 2020 | $2,619 | $14,818 | $664 | $14,154 |
| 2019 | $2,635 | $16,499 | $664 | $15,835 |
| 2018 | $2,589 | $16,499 | $664 | $15,835 |
| 2017 | $3,341 | $15,468 | $604 | $14,864 |
| 2016 | $3,108 | $15,468 | $604 | $14,864 |
| 2015 | $2,944 | $16,011 | $604 | $15,407 |
| 2014 | $3,045 | $16,353 | $543 | $15,810 |
| 2013 | $2,985 | $16,353 | $543 | $15,810 |
Source: Public Records
Map
Nearby Homes
- 3102 W Berteau Ave Unit 31023
- 4015 N Albany Ave
- 3024 W Irving Park Rd Unit 1S
- 3042 W Irving Park Rd
- 4018 N Albany Ave Unit GB
- 4027 N Troy St
- 4141 N Kedzie Ave Unit 307
- 4020 N Francisco Ave
- 4116 N Kedzie Ave
- 4229 N Kedzie Ave
- 4231 N Kedzie Ave Unit 3E
- 4307 N Troy St Unit 1
- 3223 W Belle Plaine Ave
- 4316 N Albany Ave Unit 1
- 3222 W Berteau Ave Unit 2
- 4343 N Sacramento Ave Unit A-G
- 4347 N Richmond St Unit 1N
- 4347 N Richmond St Unit 1S
- 4347 N Richmond St Unit 3N
- 4347 N Richmond St Unit 2N
- 3022 W Belle Plaine Ave Unit 30
- 3022 W Belle Plaine Ave Unit 30
- 3022 W Belle Plaine Ave Unit 30
- 3022 W Belle Plaine Ave Unit 1
- 3022 W Belle Plaine Ave
- 3022 W Belle Plaine Ave Unit 2
- 3022 W Belle Plaine Ave Unit G
- 3022 W Belle Plaine Ave Unit 3
- 3022 W Belle Plaine Ave Unit G
- 3018 W Belle Plaine Ave Unit 2
- 3018 W Belle Plaine Ave Unit 30
- 3018 W Belle Plaine Ave Unit 30
- 3016 W Belle Plaine Ave Unit 30
- 3018 W Belle Plaine Ave Unit 30
- 3016 W Belle Plaine Ave Unit 30
- 3018 W Belle Plaine Ave Unit 30
- 3016 W Belle Plaine Ave Unit 30
- 3016 W Belle Plaine Ave Unit 1
- 3018 W Belle Plaine Ave Unit 3
- 3018 W Belle Plaine Ave Unit G