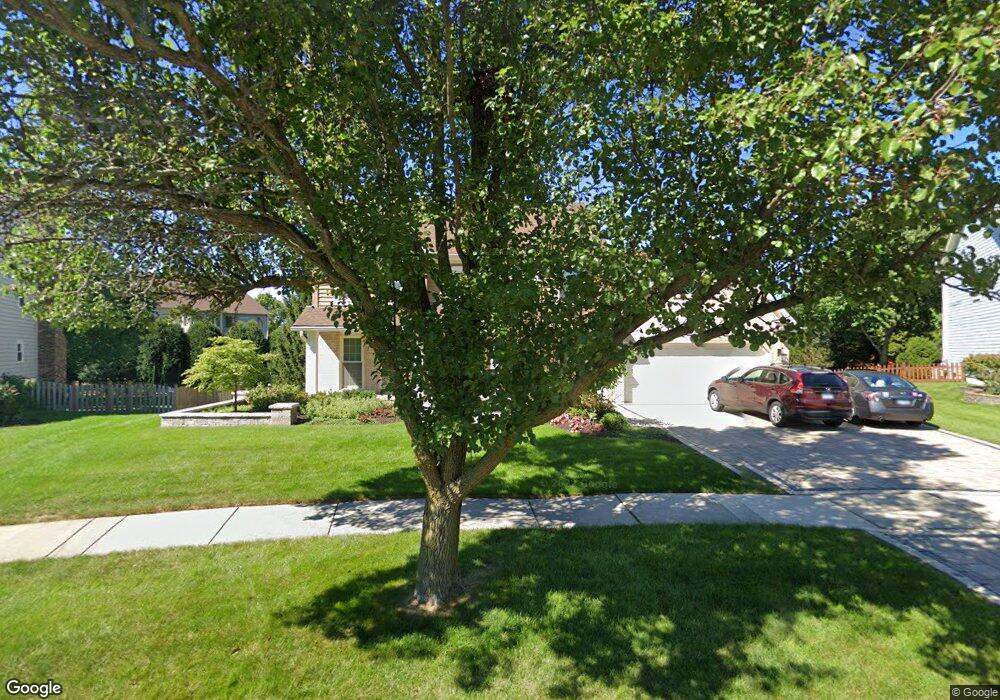
3023 Bennett Dr Naperville, IL 60564
Ashbury NeighborhoodEstimated Value: $677,000 - $759,000
Studio
1
Bath
3,078
Sq Ft
$234/Sq Ft
Est. Value
About This Home
This home is located at 3023 Bennett Dr, Naperville, IL 60564 and is currently estimated at $718,858, approximately $233 per square foot. 3023 Bennett Dr is a home located in Will County with nearby schools including Patterson Elementary School, Gordon Gregory Middle School, and Neuqua Valley High School.
Ownership History
Date
Name
Owned For
Owner Type
Purchase Details
Closed on
Jul 26, 2006
Sold by
Hirsch Alan T and Schmidt Susan E
Bought by
Hirsch Alan T and Schmidt Susan E
Current Estimated Value
Purchase Details
Closed on
Jun 14, 2001
Sold by
Muguerza Jose L
Bought by
Hirsch Alan T and Schmidt Susan E
Home Financials for this Owner
Home Financials are based on the most recent Mortgage that was taken out on this home.
Original Mortgage
$130,000
Interest Rate
7.22%
Mortgage Type
Balloon
Purchase Details
Closed on
Oct 31, 1993
Sold by
Marksberry Dale G and Marksberry June E
Bought by
Muguerza Jose L and Muguerza Lourdes Villalva
Home Financials for this Owner
Home Financials are based on the most recent Mortgage that was taken out on this home.
Original Mortgage
$135,000
Interest Rate
7.1%
Create a Home Valuation Report for This Property
The Home Valuation Report is an in-depth analysis detailing your home's value as well as a comparison with similar homes in the area
Home Values in the Area
Average Home Value in this Area
Purchase History
| Date | Buyer | Sale Price | Title Company |
|---|---|---|---|
| Hirsch Alan T | -- | None Available | |
| Hirsch Alan T | $372,500 | Law Title Pick Up | |
| Muguerza Jose L | $248,500 | First American Title Insuran |
Source: Public Records
Mortgage History
| Date | Status | Borrower | Loan Amount |
|---|---|---|---|
| Closed | Hirsch Alan T | $130,000 | |
| Previous Owner | Muguerza Jose L | $135,000 |
Source: Public Records
Tax History
| Year | Tax Paid | Tax Assessment Tax Assessment Total Assessment is a certain percentage of the fair market value that is determined by local assessors to be the total taxable value of land and additions on the property. | Land | Improvement |
|---|---|---|---|---|
| 2024 | $13,721 | $219,000 | $65,131 | $153,869 |
| 2023 | $13,721 | $193,463 | $57,536 | $135,927 |
| 2022 | $13,074 | $182,170 | $54,428 | $127,742 |
| 2021 | $12,090 | $171,980 | $51,836 | $120,144 |
| 2020 | $11,861 | $169,255 | $51,015 | $118,240 |
| 2019 | $11,295 | $164,485 | $49,577 | $114,908 |
| 2018 | $11,324 | $162,102 | $48,487 | $113,615 |
| 2017 | $11,141 | $157,917 | $47,235 | $110,682 |
| 2016 | $11,112 | $154,517 | $46,218 | $108,299 |
| 2015 | $11,212 | $143,640 | $44,440 | $99,200 |
| 2014 | $11,212 | $140,064 | $44,440 | $95,624 |
| 2013 | $11,212 | $140,064 | $44,440 | $95,624 |
Source: Public Records
Map
Nearby Homes
- 3111 Landore Dr
- 3027 Brossman St
- 1367 Saxon Ln
- 1364 Saxon Ln
- 3412 Falkner Dr
- 1244 Hollingswood Ave
- 28W555 Leverenz Rd
- 28W587 Leverenz Rd
- 2627 Homestead Dr
- 1007 Hollingswood Ct
- 1137 Crimson Ct
- 2828 Bluewater Cir
- 3339 Timber Creek Ln Unit 3
- 1321 Galena Ct
- 3740 Caine Dr
- 3718 Tramore Ct
- 2423 Durango Ln
- 2240 Mecan Dr
- 2715 Wendy Dr
- 2711 Wendy Dr
- 3019 Bennett Dr
- 3027 Bennett Dr
- 2908 Willow Ridge Dr
- 2912 Willow Ridge Dr
- 2904 Willow Ridge Dr
- 3031 Bennett Dr
- 2916 Willow Ridge Dr
- 3015 Bennett Dr
- 3016 Bennett Dr
- 3103 Landore Dr
- 2920 Willow Ridge Dr
- 3032 Bennett Dr
- 3011 Bennett Dr
- 3035 Bennett Dr
- 2915 Willow Ridge Dr
- 2820 Willow Ridge Dr
- 3036 Bennett Dr
- 2924 Willow Ridge Dr
- 2919 Willow Ridge Dr
- 3008 Bennett Dr
Your Personal Tour Guide
Ask me questions while you tour the home.