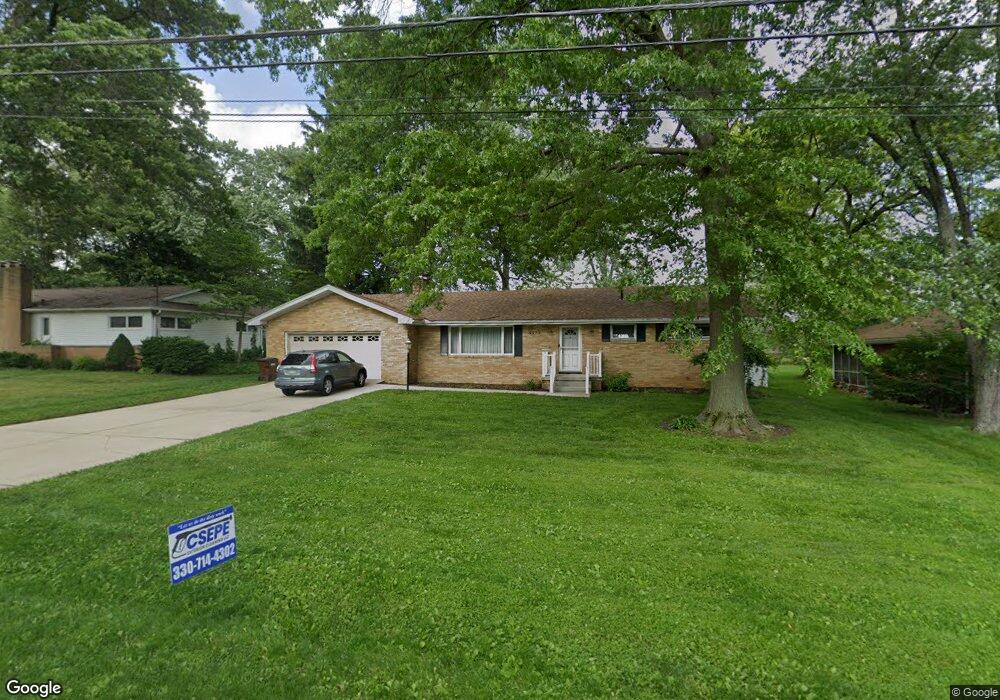
3023 Stanley Rd Fairlawn, OH 44333
Estimated Value: $267,614 - $294,000
3
Beds
2
Baths
1,378
Sq Ft
$202/Sq Ft
Est. Value
About This Home
This home is located at 3023 Stanley Rd, Fairlawn, OH 44333 and is currently estimated at $277,904, approximately $201 per square foot. 3023 Stanley Rd is a home located in Summit County with nearby schools including Copley-Fairlawn Middle School, Copley High School, and Fairlawn Lutheran School.
Ownership History
Date
Name
Owned For
Owner Type
Purchase Details
Closed on
Nov 7, 2016
Sold by
Tolbert Linda L
Bought by
Taylor Nolon and Tolbert Linda L
Current Estimated Value
Home Financials for this Owner
Home Financials are based on the most recent Mortgage that was taken out on this home.
Original Mortgage
$137,150
Outstanding Balance
$108,919
Interest Rate
3.42%
Mortgage Type
New Conventional
Estimated Equity
$168,985
Purchase Details
Closed on
Aug 21, 2006
Sold by
Elias John and Denious June
Bought by
Tolbert Linda L
Home Financials for this Owner
Home Financials are based on the most recent Mortgage that was taken out on this home.
Original Mortgage
$155,000
Interest Rate
6.59%
Mortgage Type
Purchase Money Mortgage
Purchase Details
Closed on
Jun 15, 2005
Sold by
Elias Louise
Bought by
Elias Louise and Denious June
Create a Home Valuation Report for This Property
The Home Valuation Report is an in-depth analysis detailing your home's value as well as a comparison with similar homes in the area
Home Values in the Area
Average Home Value in this Area
Purchase History
| Date | Buyer | Sale Price | Title Company |
|---|---|---|---|
| Taylor Nolon | -- | Erieview Title Agency Llc | |
| Tolbert Linda L | $155,000 | None Available | |
| Elias Louise | -- | -- |
Source: Public Records
Mortgage History
| Date | Status | Borrower | Loan Amount |
|---|---|---|---|
| Open | Taylor Nolon | $137,150 | |
| Closed | Tolbert Linda L | $155,000 |
Source: Public Records
Tax History
| Year | Tax Paid | Tax Assessment Tax Assessment Total Assessment is a certain percentage of the fair market value that is determined by local assessors to be the total taxable value of land and additions on the property. | Land | Improvement |
|---|---|---|---|---|
| 2025 | $3,057 | $77,029 | $17,525 | $59,504 |
| 2024 | $3,057 | $77,029 | $17,525 | $59,504 |
| 2023 | $3,057 | $77,029 | $17,525 | $59,504 |
| 2022 | $2,781 | $57,919 | $13,178 | $44,741 |
| 2021 | $2,613 | $57,919 | $13,178 | $44,741 |
| 2020 | $2,554 | $57,920 | $13,180 | $44,740 |
| 2019 | $2,584 | $52,480 | $12,520 | $39,960 |
| 2018 | $2,532 | $52,480 | $12,520 | $39,960 |
| 2017 | $2,309 | $52,480 | $12,520 | $39,960 |
| 2016 | $2,307 | $44,770 | $12,520 | $32,250 |
| 2015 | $2,309 | $44,770 | $12,520 | $32,250 |
| 2014 | $2,300 | $44,770 | $12,520 | $32,250 |
| 2013 | $2,232 | $43,530 | $12,520 | $31,010 |
Source: Public Records
Map
Nearby Homes
- 3081 Bancroft Rd
- 178 Benson Rd
- 71 Winchester Rd
- 2854 Riviera Dr
- 2816 Riviera Dr
- 2820 Fort Island Dr
- 96 S Miller Rd
- 3312 Bancroft Rd
- V/L White Tail Ridge Dr
- 1006 Bunker Dr Unit 203
- 3384 S Smith Rd
- 568 Hampshire Rd
- 1012 Bunker Dr Unit 304
- 151 Shiawassee Ave
- 2987 Woodcrest Dr
- 0 Brunsdorph Rd
- 2592 Falmouth Rd
- 192 Durward Rd
- 2445 Chatham Rd
- 236 Schocalog Rd
- 3015 Stanley Rd
- 3033 Stanley Rd
- 2970 Morewood Rd
- 324 Edmore Rd
- 3005 Stanley Rd
- 3043 Stanley Rd
- 2960 Morewood Rd
- 2988 Morewood Rd
- 3040 Stanley Rd
- 323 Edmore Rd
- 334 Edmore Rd
- 2995 Stanley Rd
- 3053 Stanley Rd
- 2950 Morewood Rd
- 2998 Morewood Rd
- 333 Edmore Rd
- 342 Edmore Rd
- 231 Benson Rd
- 3008 Morewood Rd
- 3063 Stanley Rd
Your Personal Tour Guide
Ask me questions while you tour the home.