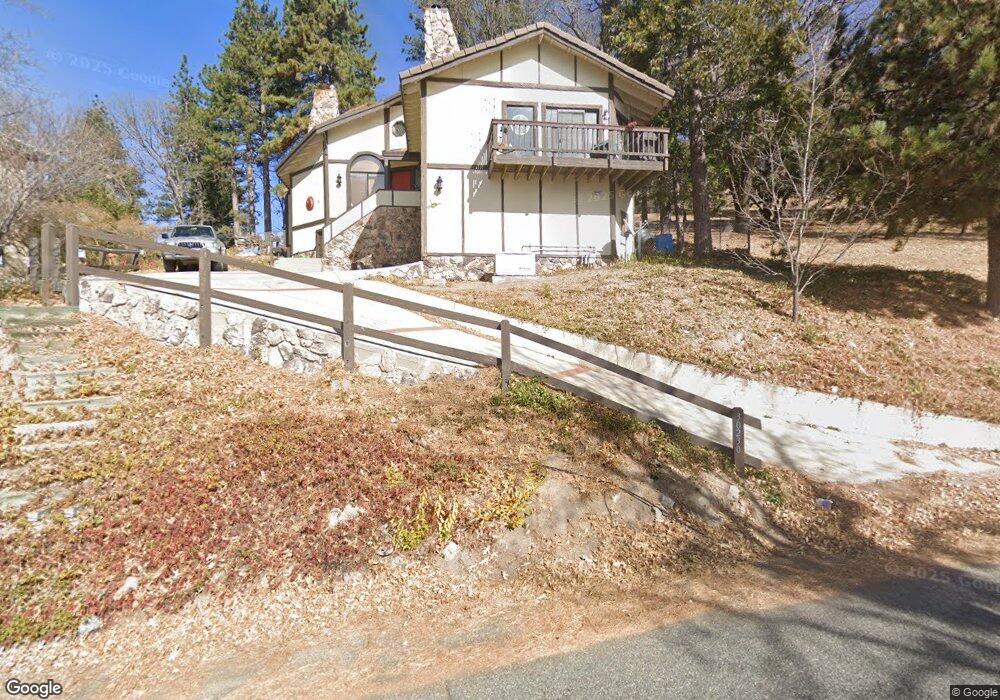
30230 Enchanted Way Running Springs, CA 92382
Estimated Value: $486,195 - $694,000
3
Beds
2
Baths
2,393
Sq Ft
$235/Sq Ft
Est. Value
About This Home
This home is located at 30230 Enchanted Way, Running Springs, CA 92382 and is currently estimated at $561,549, approximately $234 per square foot. 30230 Enchanted Way is a home with nearby schools including Charles Hoffman Elementary School, Mary P. Henck Intermediate School, and Rim Of The World Senior High School.
Ownership History
Date
Name
Owned For
Owner Type
Purchase Details
Closed on
Feb 20, 1998
Sold by
Foster Gunter Fritz
Bought by
Baxter Benjamin C and Baxter Mary E
Current Estimated Value
Home Financials for this Owner
Home Financials are based on the most recent Mortgage that was taken out on this home.
Original Mortgage
$152,608
Outstanding Balance
$26,776
Interest Rate
6.9%
Mortgage Type
FHA
Estimated Equity
$534,773
Purchase Details
Closed on
Aug 25, 1997
Sold by
Foster Family Trust and Funter Fritz
Bought by
Foster Gunter Fritz
Home Financials for this Owner
Home Financials are based on the most recent Mortgage that was taken out on this home.
Original Mortgage
$110,000
Interest Rate
7.42%
Purchase Details
Closed on
Jun 24, 1994
Sold by
Foster Gunter Fritz and Foster Karla Marie
Bought by
Foster Family Trust
Create a Home Valuation Report for This Property
The Home Valuation Report is an in-depth analysis detailing your home's value as well as a comparison with similar homes in the area
Home Values in the Area
Average Home Value in this Area
Purchase History
| Date | Buyer | Sale Price | Title Company |
|---|---|---|---|
| Baxter Benjamin C | $156,500 | Commonwealth Land Title Co | |
| Foster Gunter Fritz | -- | Chicago Title Co | |
| Foster Family Trust | -- | -- |
Source: Public Records
Mortgage History
| Date | Status | Borrower | Loan Amount |
|---|---|---|---|
| Open | Baxter Benjamin C | $152,608 | |
| Previous Owner | Foster Gunter Fritz | $110,000 |
Source: Public Records
Tax History Compared to Growth
Tax History
| Year | Tax Paid | Tax Assessment Tax Assessment Total Assessment is a certain percentage of the fair market value that is determined by local assessors to be the total taxable value of land and additions on the property. | Land | Improvement |
|---|---|---|---|---|
| 2025 | $3,025 | $245,352 | $41,547 | $203,805 |
| 2024 | $3,025 | $240,541 | $40,732 | $199,809 |
| 2023 | $2,990 | $235,824 | $39,933 | $195,891 |
| 2022 | $2,933 | $231,200 | $39,150 | $192,050 |
| 2021 | $2,900 | $226,666 | $38,382 | $188,284 |
| 2020 | $2,899 | $224,341 | $37,988 | $186,353 |
| 2019 | $2,827 | $219,942 | $37,243 | $182,699 |
| 2018 | $2,673 | $215,630 | $36,513 | $179,117 |
| 2017 | $2,624 | $211,402 | $35,797 | $175,605 |
| 2016 | $2,545 | $207,257 | $35,095 | $172,162 |
| 2015 | $2,518 | $204,144 | $34,568 | $169,576 |
| 2014 | $2,476 | $200,145 | $33,891 | $166,254 |
Source: Public Records
Map
Nearby Homes
- 30191 Enchanted Way
- 30184 Enchanted Way
- 30169 Magic Dr
- 30172 Enchanted Way
- 30184 Skyline Dr
- 30134 Enchanted Way
- 30215 Elfin Ct
- 30308 Leprechaun Dr
- 30097 Enchanted Way
- 30061 Pixie Dr
- 30110 Skyline Dr
- 30042 Enchanted Way
- 30421 Live Oak Dr
- 30461 Live Oak Dr
- 30400 Live Oak Dr
- 31588 Old City Creek Rd
- 30611 Ferndale Dr
- 30607 Live Oak Dr
- 246 Lot Ferndale Dr
- Lot 246 Ferndale Dr
- 30219 Leprechaun
- 30235 Leprechaun Dr
- 30244 Enchanted Way
- 30245 Leprechaun Dr
- 30243 Enchanted Way
- 30259 Leprechaun
- 30211 Magic Dr
- 30201 Enchanted Way
- 30200 Enchanted Way
- 30280 Leprechaun Ct
- 30234 Leprechaun
- 30246 Leprechaun Dr
- 30199 Magic Dr
- 30265 Enchanted Way
- 30258 Leprechaun
- 30196 Enchanted Way
- 30287 Leprechaun Ct
- 30187 Magic Dr
- 30181 Enchanted Way
- 30300 Live Oak Dr