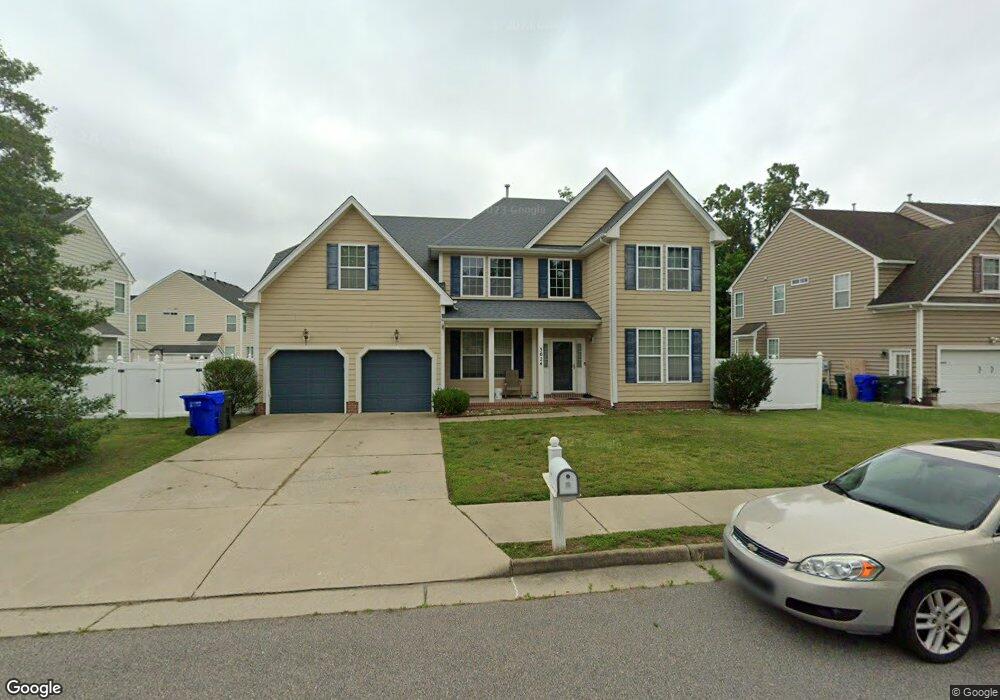
3024 Elmore Cir Suffolk, VA 23434
Holy Neck NeighborhoodEstimated Value: $456,000 - $483,000
5
Beds
3
Baths
2,908
Sq Ft
$161/Sq Ft
Est. Value
About This Home
This home is located at 3024 Elmore Cir, Suffolk, VA 23434 and is currently estimated at $466,755, approximately $160 per square foot. 3024 Elmore Cir is a home located in Suffolk City with nearby schools including Kilby Shores Elementary School, Forest Glen Middle School, and Lakeland High School.
Ownership History
Date
Name
Owned For
Owner Type
Purchase Details
Closed on
Sep 18, 2023
Sold by
Daniels Gerald J
Bought by
Genoese Samuel A and Genoese Emily K
Current Estimated Value
Home Financials for this Owner
Home Financials are based on the most recent Mortgage that was taken out on this home.
Original Mortgage
$344,000
Outstanding Balance
$336,704
Interest Rate
6.96%
Mortgage Type
New Conventional
Estimated Equity
$130,051
Purchase Details
Closed on
Feb 28, 2018
Sold by
Jones Willie J and Jones Jacqueline R
Bought by
Daniels Gerald J
Home Financials for this Owner
Home Financials are based on the most recent Mortgage that was taken out on this home.
Original Mortgage
$311,557
Interest Rate
4.04%
Mortgage Type
VA
Purchase Details
Closed on
Jan 8, 2010
Sold by
Hearndon Brewers Meadow Blds
Bought by
Jones Willie J
Home Financials for this Owner
Home Financials are based on the most recent Mortgage that was taken out on this home.
Original Mortgage
$328,494
Interest Rate
4.78%
Mortgage Type
VA
Create a Home Valuation Report for This Property
The Home Valuation Report is an in-depth analysis detailing your home's value as well as a comparison with similar homes in the area
Home Values in the Area
Average Home Value in this Area
Purchase History
| Date | Buyer | Sale Price | Title Company |
|---|---|---|---|
| Genoese Samuel A | $430,000 | None Listed On Document | |
| Daniels Gerald J | $305,000 | Attorney | |
| Jones Willie J | $318,000 | -- |
Source: Public Records
Mortgage History
| Date | Status | Borrower | Loan Amount |
|---|---|---|---|
| Open | Genoese Samuel A | $344,000 | |
| Previous Owner | Daniels Gerald J | $311,557 | |
| Previous Owner | Jones Willie J | $328,494 |
Source: Public Records
Tax History Compared to Growth
Tax History
| Year | Tax Paid | Tax Assessment Tax Assessment Total Assessment is a certain percentage of the fair market value that is determined by local assessors to be the total taxable value of land and additions on the property. | Land | Improvement |
|---|---|---|---|---|
| 2024 | $5,034 | $423,700 | $75,000 | $348,700 |
| 2023 | $4,927 | $414,900 | $75,000 | $339,900 |
| 2022 | $4,049 | $371,500 | $75,000 | $296,500 |
| 2021 | $3,681 | $331,600 | $62,100 | $269,500 |
| 2020 | $3,432 | $309,200 | $62,100 | $247,100 |
| 2019 | $3,307 | $297,900 | $62,100 | $235,800 |
| 2018 | $3,171 | $289,100 | $62,100 | $227,000 |
| 2017 | $3,093 | $289,100 | $62,100 | $227,000 |
| 2016 | $2,978 | $278,300 | $62,100 | $216,200 |
| 2015 | $1,577 | $267,500 | $62,100 | $205,400 |
| 2014 | $1,577 | $267,500 | $62,100 | $205,400 |
Source: Public Records
Map
Nearby Homes
- 4035 Brians Ln
- 506 Deer Run Ct
- GALEN Plan at Brewers Meadows South
- HAYDEN Plan at Brewers Meadows South
- SALEM Plan at Brewers Meadows South
- PENWELL Plan at Brewers Meadows South
- HANOVER Plan at Brewers Meadows South
- 4043 Brians Ln
- 4040 Brians Ln
- 4045 Brians Ln
- 4042 Brians Ln
- 4048 Brians Ln
- 318 Tarn Ct
- 317 Tarn Ct
- 312 Tarn Ct
- 314 Tarn Ct
- 510 Boxwood Ct
- 1510 Brittle Dr
- 201 Turlington Rd
- Quinn Plan at Edgewater - Smart Living
- 3022 Elmore Cir
- 3026 Elmore Cir
- 2122 Brians Ln
- 2124 Brians Ln
- 3137 Brians Ln
- 2126 Brians Ln
- 3015 Elmore Cir
- 3018 Elmore Cir
- 2121 Brians Ln
- 2123 Brians Ln
- 2119 Brian's Ln
- 2119 Brians Ln
- 2128 Brians Ln
- 2125 Brians Ln
- 2117 Brians Ln
- 3016 Elmore Cir
- 2127 Brians Ln
- 2130 Brians Ln
- 2115 Brians Ln
- 3014 Elmore Cir