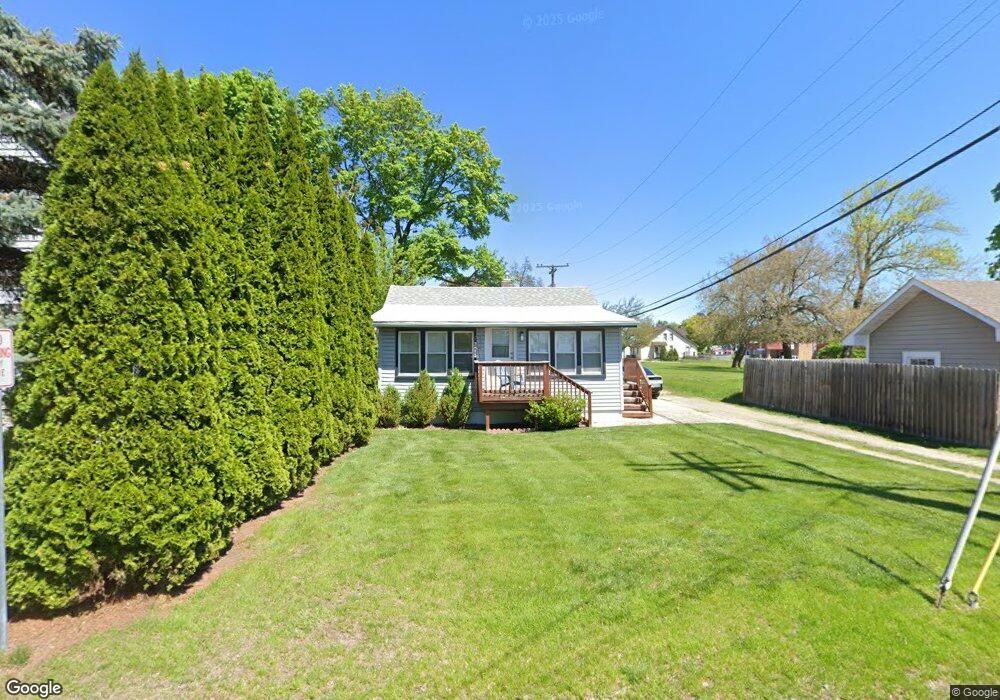
3024 Portman St Keego Harbor, MI 48320
Estimated Value: $181,843 - $200,000
1
Bed
1
Bath
842
Sq Ft
$227/Sq Ft
Est. Value
About This Home
This home is located at 3024 Portman St, Keego Harbor, MI 48320 and is currently estimated at $191,461, approximately $227 per square foot. 3024 Portman St is a home located in Oakland County with nearby schools including Momentum Academy, Waterford Montessori Academy, and The Susan And Rabbi Harold Loss Ecc.
Ownership History
Date
Name
Owned For
Owner Type
Purchase Details
Closed on
Oct 26, 2018
Sold by
Yoder Joel S
Bought by
Rosen Owen M
Current Estimated Value
Purchase Details
Closed on
Sep 17, 2008
Sold by
Us Bank Na
Bought by
Yoder Joel S
Home Financials for this Owner
Home Financials are based on the most recent Mortgage that was taken out on this home.
Original Mortgage
$28,800
Interest Rate
6.43%
Mortgage Type
Purchase Money Mortgage
Purchase Details
Closed on
Aug 7, 2007
Sold by
Parker Barbara and Parker Michael
Bought by
Us Bank Na and Citigroup Mortgage Loan Trust Inc
Purchase Details
Closed on
Jan 10, 2003
Sold by
Davis Daniel C
Bought by
Parker Michael and Parker Barbara
Create a Home Valuation Report for This Property
The Home Valuation Report is an in-depth analysis detailing your home's value as well as a comparison with similar homes in the area
Home Values in the Area
Average Home Value in this Area
Purchase History
| Date | Buyer | Sale Price | Title Company |
|---|---|---|---|
| Rosen Owen M | $126,000 | Title Express Llc | |
| Yoder Joel S | $36,000 | Attorneys Title Agency Llc | |
| Us Bank Na | $82,800 | None Available | |
| Parker Michael | $70,000 | Tri County Title Agency Inc |
Source: Public Records
Mortgage History
| Date | Status | Borrower | Loan Amount |
|---|---|---|---|
| Previous Owner | Yoder Joel S | $28,800 |
Source: Public Records
Tax History Compared to Growth
Tax History
| Year | Tax Paid | Tax Assessment Tax Assessment Total Assessment is a certain percentage of the fair market value that is determined by local assessors to be the total taxable value of land and additions on the property. | Land | Improvement |
|---|---|---|---|---|
| 2024 | $2,289 | $71,350 | $0 | $0 |
| 2023 | $2,189 | $65,230 | $0 | $0 |
| 2022 | $2,148 | $57,980 | $0 | $0 |
| 2021 | $2,149 | $49,060 | $0 | $0 |
| 2020 | $2,099 | $45,550 | $0 | $0 |
| 2019 | $2,129 | $44,090 | $0 | $0 |
| 2018 | $1,708 | $35,870 | $0 | $0 |
| 2017 | $1,600 | $34,090 | $0 | $0 |
| 2016 | $1,608 | $32,210 | $0 | $0 |
| 2015 | -- | $28,860 | $0 | $0 |
| 2014 | -- | $26,480 | $0 | $0 |
| 2011 | -- | $23,700 | $0 | $0 |
Source: Public Records
Map
Nearby Homes
- 2132 Brock St
- 1970 Beechmont St
- 2952 Prynne St
- 2960 Glenbroke St
- 2182 Park Cir
- 2918 Nagle Ct
- 2820 Wall St
- 1700 Maddy Ln
- 2265 Maddy Ln
- 2428 Willow Beach St
- 1660 Beechmont St
- 1959 Woodland Ave
- 1661 Cass Lake Rd Unit D
- 1775 Woodland Ave
- 2630 Depew Dr
- 2583 Empire Dr
- 2606 Depew Dr
- 1540 Cass Lake Rd
- 2480 Walce Dr
- 1517 Kessler Ave
- 3030 Portman St
- 3038 Portman St
- 3033 Cass Lake Ave
- 3046 Portman St
- 2030 Cass Lake Rd
- 3031 Portman St Unit 1
- 3041 Cass Lake Ave
- 3037 Portman St
- 3051 Cass Lake Ave
- 3059 Cass Lake Ave
- 3029 Portman St Unit 2
- 3054 Portman St
- 3062 Portman St
- 2004 Cass Lake Rd
- 0 Cass Lake Rd
- 3027 Portman St Unit Bldg-Unit
- 3027 Portman St Unit 3
- 3070 Portman St
- 3045 Portman St
- 3025 Portman St