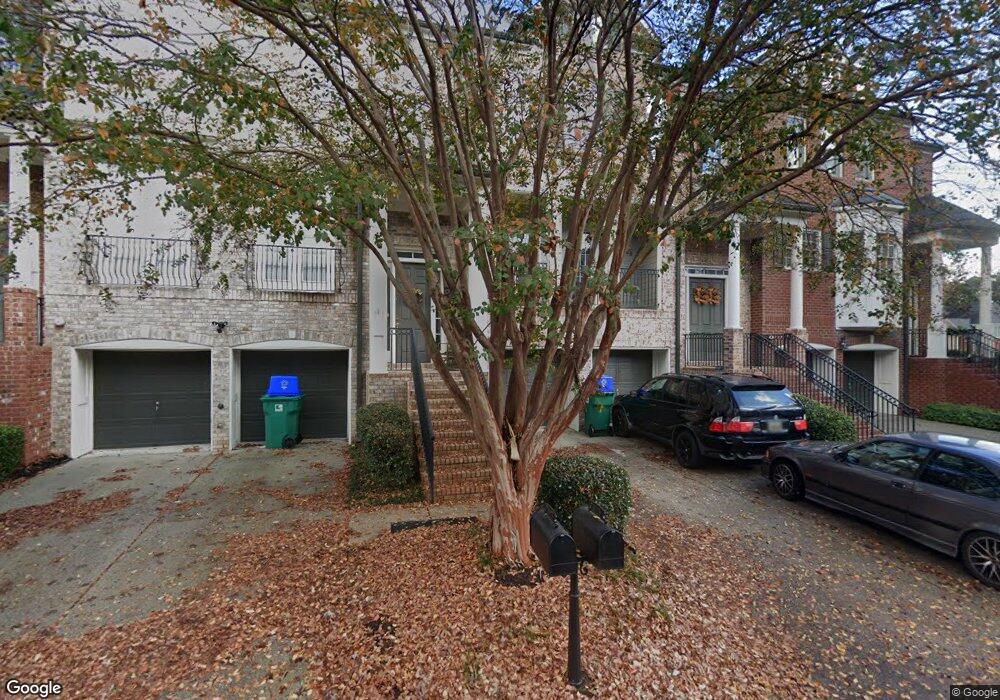
3025 Montclair Cir SE Unit 3025 Smyrna, GA 30080
Estimated Value: $533,000 - $609,000
3
Beds
4
Baths
2,673
Sq Ft
$208/Sq Ft
Est. Value
About This Home
This home is located at 3025 Montclair Cir SE Unit 3025, Smyrna, GA 30080 and is currently estimated at $556,219, approximately $208 per square foot. 3025 Montclair Cir SE Unit 3025 is a home located in Cobb County with nearby schools including Smyrna Elementary School, Campbell Middle School, and Campbell High School.
Ownership History
Date
Name
Owned For
Owner Type
Purchase Details
Closed on
Apr 28, 2017
Sold by
Bazzell Anthony L
Bought by
Bazzell Anthony L and Bazzell Michele K
Current Estimated Value
Home Financials for this Owner
Home Financials are based on the most recent Mortgage that was taken out on this home.
Original Mortgage
$328,932
Outstanding Balance
$274,392
Interest Rate
4.3%
Mortgage Type
FHA
Estimated Equity
$281,827
Purchase Details
Closed on
Aug 18, 2006
Sold by
Ammersee Long Term Invest Llc
Bought by
Kwasek Dena
Purchase Details
Closed on
Feb 20, 2003
Sold by
Ashton Atlanta Residential Llc
Bought by
Mack Michael
Home Financials for this Owner
Home Financials are based on the most recent Mortgage that was taken out on this home.
Original Mortgage
$224,280
Interest Rate
5.89%
Mortgage Type
New Conventional
Create a Home Valuation Report for This Property
The Home Valuation Report is an in-depth analysis detailing your home's value as well as a comparison with similar homes in the area
Home Values in the Area
Average Home Value in this Area
Purchase History
| Date | Buyer | Sale Price | Title Company |
|---|---|---|---|
| Bazzell Anthony L | -- | -- | |
| Bazzell Anthony L | $335,000 | -- | |
| Kwasek Dena | $345,000 | -- | |
| Mack Michael | $280,400 | -- |
Source: Public Records
Mortgage History
| Date | Status | Borrower | Loan Amount |
|---|---|---|---|
| Open | Bazzell Anthony L | $328,932 | |
| Closed | Bazzell Anthony L | $328,932 | |
| Previous Owner | Mack Michael | $224,280 |
Source: Public Records
Tax History Compared to Growth
Tax History
| Year | Tax Paid | Tax Assessment Tax Assessment Total Assessment is a certain percentage of the fair market value that is determined by local assessors to be the total taxable value of land and additions on the property. | Land | Improvement |
|---|---|---|---|---|
| 2025 | $1,415 | $199,800 | $40,000 | $159,800 |
| 2024 | $1,415 | $199,800 | $40,000 | $159,800 |
| 2023 | $1,263 | $177,256 | $30,000 | $147,256 |
| 2022 | $4,850 | $177,256 | $30,000 | $147,256 |
| 2021 | $3,984 | $144,924 | $30,000 | $114,924 |
| 2020 | $3,984 | $144,924 | $30,000 | $114,924 |
| 2019 | $3,666 | $133,352 | $30,000 | $103,352 |
| 2018 | $3,666 | $133,352 | $30,000 | $103,352 |
| 2017 | $3,172 | $123,012 | $32,000 | $91,012 |
| 2016 | $2,917 | $123,012 | $32,000 | $91,012 |
| 2015 | $2,721 | $112,944 | $24,000 | $88,944 |
| 2014 | $2,144 | $90,300 | $0 | $0 |
Source: Public Records
Map
Nearby Homes
- 3018 Montclair Cir SE Unit 57
- 3028 Montclair Cir SE
- 3064 Montclair Cir SE
- 1652 Mosaic Way
- 1582 Mosaic Way Unit 1582
- 1303 Vinings Forest Ln SE
- 1203 Vinings Forest Ln SE Unit 12
- 1460 Memory Ln SE
- 1552 Mosaic Way
- 1560 Mosaic Way
- 1483 Collier Dr SE
- 812 Vinings Forest Ln SE Unit 812
- 2861 Bernard Ln SE
- 2964 Anderson Cir SE
- 2999 Jonquil Dr SE
- 3211 Collier Gate Ct SE
- 3027 Montclair Cir SE Unit 51
- 3025 Montclair Cir SE Unit 50
- 3023 Montclair Cir SE Unit 3023
- 3023 Montclair Cir SE Unit 49
- 3023 Montclair Cir SE
- 3021 Montclair Cir SE Unit 2
- 3019 Montclair Cir SE Unit 47
- 3019 Montclair Cir SE
- 3072 Montclair Cir SE Unit 1
- 3070 Montclair Cir SE
- 3017 Montclair Cir SE
- 3017 Montclair Cir SE Unit 3017
- 3022 Montclair Cir SE Unit 55
- 3024 Montclair Cir SE Unit 54
- 3020 Montclair Cir SE Unit 56
- 3026 Montclair Cir SE Unit 53
- 1456 Montclair Ct SE Unit 31
- 3028 Montclair Cir SE Unit 52
- 3028 Montclair Cir SE Unit 3028
- 3015 Montclair Cir SE Unit 45