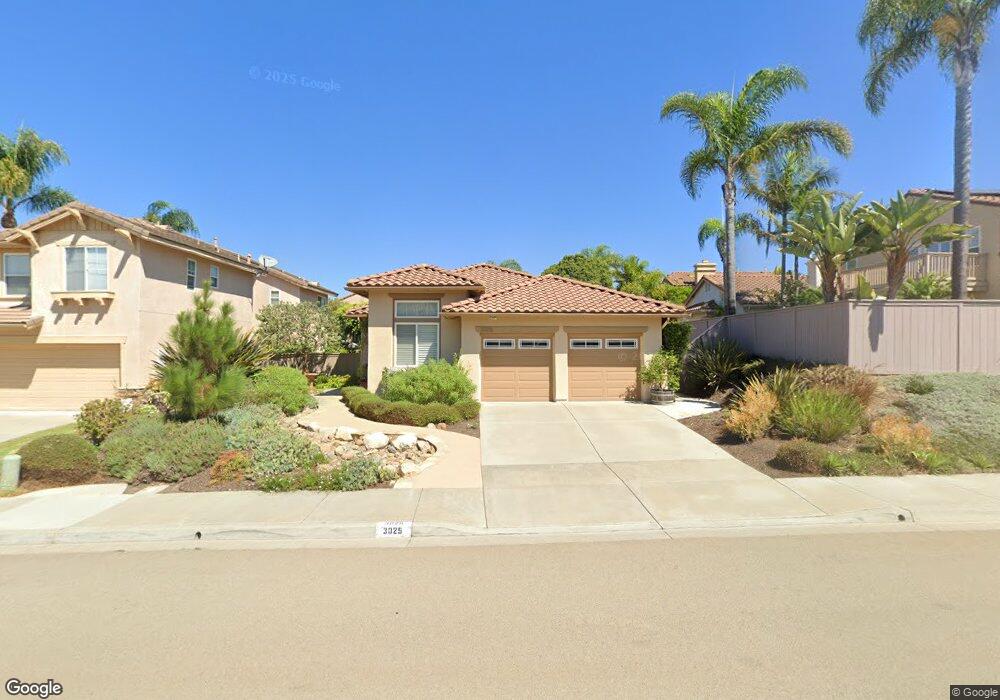
3025 Paseo Estribo Carlsbad, CA 92009
Rancho Carrillo NeighborhoodEstimated Value: $1,369,256 - $1,488,000
3
Beds
2
Baths
1,901
Sq Ft
$752/Sq Ft
Est. Value
About This Home
This home is located at 3025 Paseo Estribo, Carlsbad, CA 92009 and is currently estimated at $1,429,314, approximately $751 per square foot. 3025 Paseo Estribo is a home located in San Diego County with nearby schools including Carrillo Elementary, San Elijo Middle School, and San Marcos High School.
Ownership History
Date
Name
Owned For
Owner Type
Purchase Details
Closed on
Aug 15, 2006
Sold by
Galt Alan B and Galt Phyllis J
Bought by
Galt Alan and Galt Phyllis
Current Estimated Value
Purchase Details
Closed on
Jul 2, 2001
Sold by
Chandler G R
Bought by
Galt Alan B and Galt Phyllis J
Home Financials for this Owner
Home Financials are based on the most recent Mortgage that was taken out on this home.
Original Mortgage
$230,000
Interest Rate
7.09%
Purchase Details
Closed on
Apr 18, 2001
Sold by
Chandler Gerald R
Bought by
Chandler G R
Purchase Details
Closed on
Aug 10, 1999
Sold by
L & W Investments Inc
Bought by
Chandler Gerald R and Chandler Ellen M
Home Financials for this Owner
Home Financials are based on the most recent Mortgage that was taken out on this home.
Original Mortgage
$235,600
Interest Rate
9%
Create a Home Valuation Report for This Property
The Home Valuation Report is an in-depth analysis detailing your home's value as well as a comparison with similar homes in the area
Home Values in the Area
Average Home Value in this Area
Purchase History
| Date | Buyer | Sale Price | Title Company |
|---|---|---|---|
| Galt Alan | -- | None Available | |
| Galt Alan B | $410,000 | North American Title Co | |
| Chandler G R | -- | -- | |
| Chandler Gerald R | $295,000 | Lawyers Title |
Source: Public Records
Mortgage History
| Date | Status | Borrower | Loan Amount |
|---|---|---|---|
| Previous Owner | Galt Alan B | $230,000 | |
| Previous Owner | Chandler Gerald R | $235,600 | |
| Closed | Chandler Gerald R | $58,900 |
Source: Public Records
Tax History
| Year | Tax Paid | Tax Assessment Tax Assessment Total Assessment is a certain percentage of the fair market value that is determined by local assessors to be the total taxable value of land and additions on the property. | Land | Improvement |
|---|---|---|---|---|
| 2025 | $7,698 | $605,674 | $295,451 | $310,223 |
| 2024 | $7,698 | $593,799 | $289,658 | $304,141 |
| 2023 | $7,753 | $582,157 | $283,979 | $298,178 |
| 2022 | $8,205 | $570,743 | $278,411 | $292,332 |
| 2021 | $8,099 | $559,552 | $272,952 | $286,600 |
| 2020 | $8,032 | $553,816 | $270,154 | $283,662 |
| 2019 | $7,956 | $542,957 | $264,857 | $278,100 |
| 2018 | $7,765 | $532,312 | $259,664 | $272,648 |
| 2017 | $7,659 | $521,875 | $254,573 | $267,302 |
| 2016 | $7,513 | $511,643 | $249,582 | $262,061 |
| 2015 | $7,431 | $503,959 | $245,834 | $258,125 |
| 2014 | $7,326 | $494,088 | $241,019 | $253,069 |
Source: Public Records
Map
Nearby Homes
- 3033 Rancho la Presa
- 6064 Paseo Acampo
- 6008 Paseo Salinero
- 6103 Paseo Monona
- 6029 Rancho Bravado
- 3133 Via Puerta
- 6263 Paseo Callado
- 6259 Paseo Callado
- 6375 Paseo Potrero
- 2834 Rancho Pancho
- 2196 Coast Ave
- 2930 Rancho Cortes
- 2829 Carrillo Way
- 6376 Huntington Dr
- 2927 Rancho Cortes
- 2119 Sand Crest Way
- 6412 Terraza Portico
- 6415 Terraza Portico Unit 79
- 6140 Colt Place Unit 104
- 6555 Via Barona
- 3029 Paseo Estribo
- 6129 Paseo Tapajos
- 6125 Paseo Tapajos
- 6121 Paseo Tapajos
- 6110 Paseo Jaquita
- 3033 Paseo Estribo
- 6106 Paseo Jaquita
- 6114 Paseo Jaquita
- 3042 Paseo Estribo
- 6117 Paseo Tapajos
- 6139 Paseo Tapajos
- 3037 Paseo Estribo
- 6118 Paseo Jaquita
- 6113 Paseo Tapajos
- 3046 Paseo Estribo
- 6143 Paseo Tapajos
- 3041 Paseo Estribo
- 6122 Paseo Jaquita
- 6109 Paseo Tapajos
- 6128 Paseo Tapajos
Your Personal Tour Guide
Ask me questions while you tour the home.