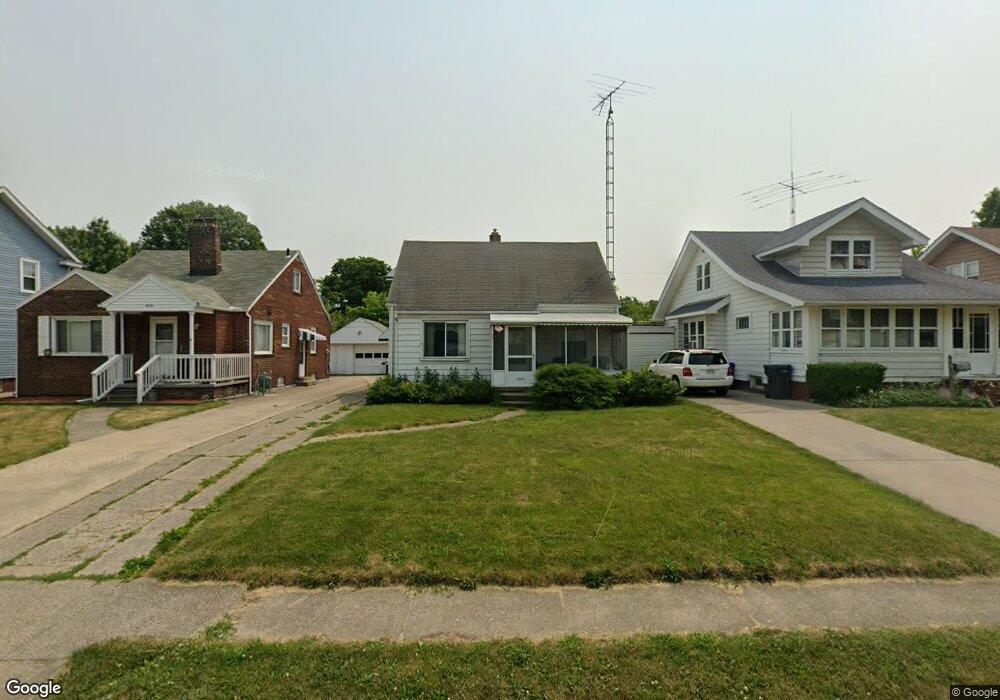
3026 117th St Toledo, OH 43611
Point Place NeighborhoodEstimated Value: $127,000 - $141,000
3
Beds
1
Bath
1,055
Sq Ft
$128/Sq Ft
Est. Value
About This Home
This home is located at 3026 117th St, Toledo, OH 43611 and is currently estimated at $134,992, approximately $127 per square foot. 3026 117th St is a home located in Lucas County with nearby schools including Ottawa River Elementary School, Woodward High School, and Imagine Environmental Science Academy.
Ownership History
Date
Name
Owned For
Owner Type
Purchase Details
Closed on
Sep 29, 2023
Sold by
Kerekes Edward L and Kerekes Thomas A
Bought by
Bkm Real Estate Llc
Current Estimated Value
Home Financials for this Owner
Home Financials are based on the most recent Mortgage that was taken out on this home.
Original Mortgage
$88,000
Outstanding Balance
$86,260
Interest Rate
7.09%
Mortgage Type
New Conventional
Estimated Equity
$48,732
Purchase Details
Closed on
Nov 18, 2022
Sold by
Kerekes Edward Louis and Kerekes Emma H
Bought by
Kerekes Edward Louis
Purchase Details
Closed on
Nov 17, 1993
Sold by
Kerekes E H and E H
Create a Home Valuation Report for This Property
The Home Valuation Report is an in-depth analysis detailing your home's value as well as a comparison with similar homes in the area
Home Values in the Area
Average Home Value in this Area
Purchase History
| Date | Buyer | Sale Price | Title Company |
|---|---|---|---|
| Bkm Real Estate Llc | $110,000 | Louisville Title | |
| Kerekes Edward Louis | -- | -- | |
| -- | -- | -- |
Source: Public Records
Mortgage History
| Date | Status | Borrower | Loan Amount |
|---|---|---|---|
| Open | Bkm Real Estate Llc | $88,000 |
Source: Public Records
Tax History Compared to Growth
Tax History
| Year | Tax Paid | Tax Assessment Tax Assessment Total Assessment is a certain percentage of the fair market value that is determined by local assessors to be the total taxable value of land and additions on the property. | Land | Improvement |
|---|---|---|---|---|
| 2024 | $1,069 | $34,825 | $7,840 | $26,985 |
| 2023 | $1,005 | $23,590 | $6,125 | $17,465 |
| 2022 | $1,019 | $23,590 | $6,125 | $17,465 |
| 2021 | $1,054 | $23,590 | $6,125 | $17,465 |
| 2020 | $1,064 | $21,805 | $4,830 | $16,975 |
| 2019 | $1,025 | $21,805 | $4,830 | $16,975 |
| 2018 | $1,036 | $21,805 | $4,830 | $16,975 |
| 2017 | $1,022 | $21,315 | $4,725 | $16,590 |
| 2016 | $1,031 | $60,900 | $13,500 | $47,400 |
| 2015 | $1,042 | $60,900 | $13,500 | $47,400 |
| 2014 | $790 | $21,320 | $4,730 | $16,590 |
| 2013 | $790 | $21,320 | $4,730 | $16,590 |
Source: Public Records
Map
Nearby Homes