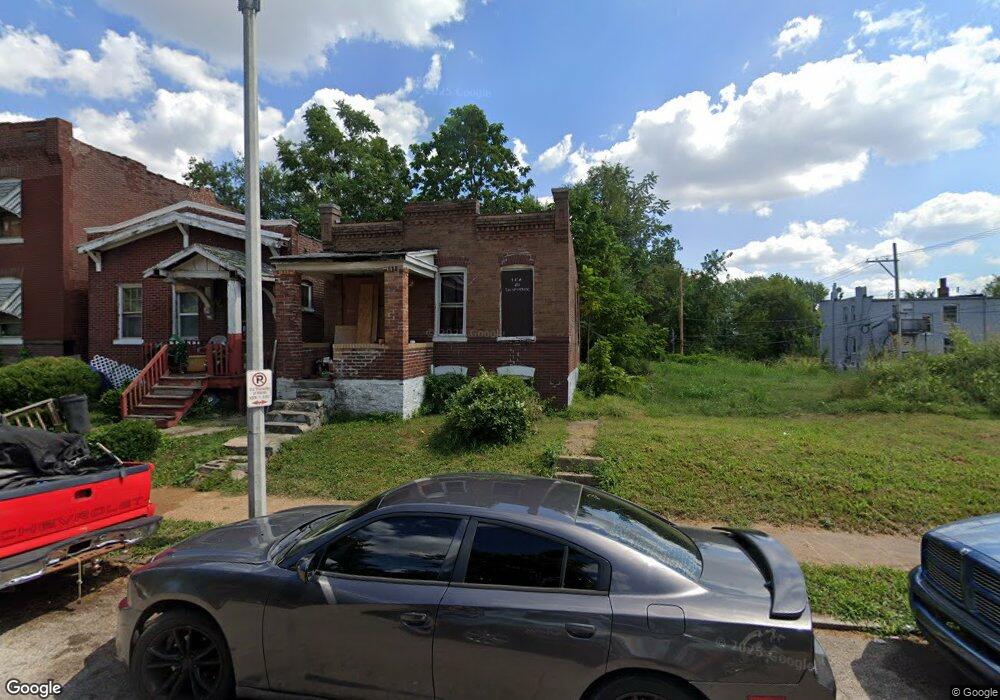
3026 Rolla Place Saint Louis, MO 63115
Greater Ville NeighborhoodEstimated Value: $43,000 - $56,000
2
Beds
1
Bath
956
Sq Ft
$50/Sq Ft
Est. Value
About This Home
This home is located at 3026 Rolla Place, Saint Louis, MO 63115 and is currently estimated at $47,610, approximately $49 per square foot. 3026 Rolla Place is a home located in St. Louis City with nearby schools including Hickey Elementary School, Sumner High School, and Emerson Academy Therapeutic School.
Ownership History
Date
Name
Owned For
Owner Type
Purchase Details
Closed on
Aug 4, 2021
Sold by
Land Reutilization Authority Of City Of
Bought by
Ladd Shannon
Current Estimated Value
Purchase Details
Closed on
Oct 15, 2019
Sold by
Parcels Of Land Encumbered With Delinque
Bought by
Land Reutlization Authority Of City Of S
Purchase Details
Closed on
Mar 29, 2010
Sold by
Real Estate Mortgage Network Inc
Bought by
Gaddis Antonio
Purchase Details
Closed on
Mar 24, 2010
Sold by
Novastar Mortgage Inc
Bought by
Insource Financial Services Llc
Purchase Details
Closed on
Feb 5, 2010
Sold by
Econohomes Llc
Bought by
Davis Yvetta
Purchase Details
Closed on
Oct 8, 2009
Sold by
Gaddis Antonio and Weatherford Laneise
Bought by
Econohomes Llc
Purchase Details
Closed on
Apr 22, 1998
Sold by
Dorothy Jordan and Dorothy Florie D
Bought by
Jordan Dorothy
Create a Home Valuation Report for This Property
The Home Valuation Report is an in-depth analysis detailing your home's value as well as a comparison with similar homes in the area
Home Values in the Area
Average Home Value in this Area
Purchase History
| Date | Buyer | Sale Price | Title Company |
|---|---|---|---|
| Ladd Shannon | $1,600 | None Available | |
| Land Reutlization Authority Of City Of S | -- | None Available | |
| Gaddis Antonio | -- | None Available | |
| Real Estate Mortgage Network Inc | -- | None Available | |
| Insource Financial Services Llc | -- | None Available | |
| Davis Yvetta | $3,850 | None Available | |
| Econohomes Llc | $3,500 | None Available | |
| Jordan Dorothy | -- | -- |
Source: Public Records
Tax History Compared to Growth
Tax History
| Year | Tax Paid | Tax Assessment Tax Assessment Total Assessment is a certain percentage of the fair market value that is determined by local assessors to be the total taxable value of land and additions on the property. | Land | Improvement |
|---|---|---|---|---|
| 2025 | $107 | $970 | $150 | $820 |
| 2024 | $103 | $940 | $150 | $790 |
| 2023 | $103 | $940 | $150 | $790 |
| 2022 | $103 | $910 | $150 | $760 |
| 2021 | $0 | $1,520 | $150 | $1,370 |
| 2020 | $0 | $1,520 | $150 | $1,370 |
| 2019 | $152 | $1,520 | $150 | $1,370 |
| 2018 | $140 | $1,330 | $150 | $1,180 |
| 2017 | $138 | $1,330 | $150 | $1,180 |
| 2016 | $155 | $1,520 | $340 | $1,180 |
| 2015 | $143 | $1,520 | $340 | $1,180 |
| 2014 | $140 | $1,520 | $340 | $1,180 |
| 2013 | -- | $1,480 | $340 | $1,140 |
Source: Public Records
Map
Nearby Homes
- 4149 Labadie Ave
- 4200 E Labadie Ave
- 3130 Whittier St
- 3121 Fair Ave
- 3119 N Sarah St
- 4275 E Ashland Ave
- 4204 E Lexington Ave
- 4059 Maffitt Ave
- 4153 E Lexington Ave
- 4017 Maffitt Ave
- 4453 Cottage Ave
- 4043 Palm St
- 4196 Sacramento Ave
- 4027 Palm St
- 4003 Lexington Ave
- 3930 Sullivan Ave
- 4219 E Sacramento Ave
- 4047 Cottage Ave
- 4132 San Francisco Ave
- 3936 Lexington Ave
- 3030 Rolla Place
- 3032 Rolla Place
- 3034 Rolla Place
- 3038 Rolla Place
- 3025 Whittier St
- 3027 Whittier St
- 3023 Whittier St
- 3029 Whittier St
- 3031 Whittier St
- 3033 Whittier St
- 3040 Rolla Place
- 3015 Whittier St
- 3027 Rolla Place
- 3025 Rolla Place
- 4211 E Labadie Ave
- 4215 E Labadie Ave
- 3037 Whittier St
- 3033 Rolla Place
- 3044 Rolla Place
- 4207 E Labadie Ave