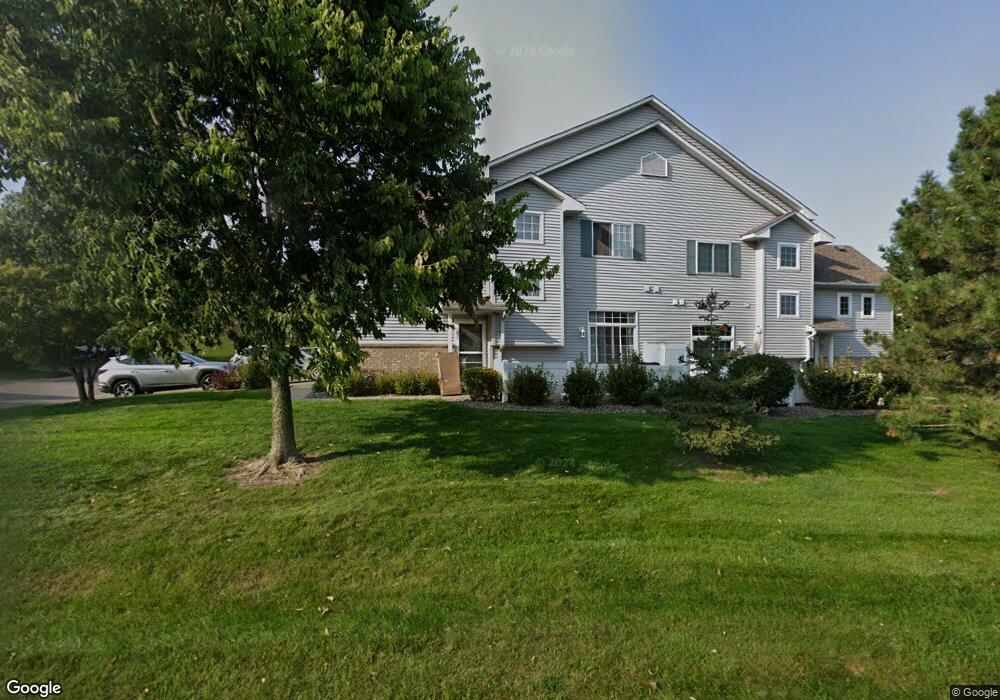
3027 Juniper Ln Unit E Woodbury, MN 55125
Estimated Value: $291,000 - $303,000
2
Beds
3
Baths
1,634
Sq Ft
$180/Sq Ft
Est. Value
About This Home
This home is located at 3027 Juniper Ln Unit E, Woodbury, MN 55125 and is currently estimated at $294,468, approximately $180 per square foot. 3027 Juniper Ln Unit E is a home located in Washington County with nearby schools including Red Rock Elementary School, Lake Middle School, and East Ridge High School.
Ownership History
Date
Name
Owned For
Owner Type
Purchase Details
Closed on
Jul 31, 2013
Sold by
Heeren Jonathan and Heeren Kristin M
Bought by
Kempf Mary J
Current Estimated Value
Home Financials for this Owner
Home Financials are based on the most recent Mortgage that was taken out on this home.
Original Mortgage
$145,000
Outstanding Balance
$34,201
Interest Rate
3.37%
Mortgage Type
New Conventional
Estimated Equity
$260,267
Purchase Details
Closed on
May 15, 2006
Sold by
Kubicek Brian and Kubicek Randa
Bought by
Osterberg Kristin M
Purchase Details
Closed on
Feb 28, 2002
Sold by
Primozich Michael and Primozich Nicole
Bought by
Krenz Jeffrey M
Purchase Details
Closed on
Nov 26, 2001
Sold by
Longworth Leroy J and Longworth Karen L
Bought by
Kubicek Brian A
Purchase Details
Closed on
Sep 8, 1999
Sold by
Centex Homes Minnesota Division
Bought by
Smith Karen L and Longworth Leroy
Create a Home Valuation Report for This Property
The Home Valuation Report is an in-depth analysis detailing your home's value as well as a comparison with similar homes in the area
Home Values in the Area
Average Home Value in this Area
Purchase History
| Date | Buyer | Sale Price | Title Company |
|---|---|---|---|
| Kempf Mary J | $165,000 | Home Title | |
| Osterberg Kristin M | $199,000 | -- | |
| Krenz Jeffrey M | $166,000 | -- | |
| Kubicek Brian A | $170,000 | -- | |
| Smith Karen L | $135,360 | -- |
Source: Public Records
Mortgage History
| Date | Status | Borrower | Loan Amount |
|---|---|---|---|
| Open | Kempf Mary J | $145,000 |
Source: Public Records
Tax History Compared to Growth
Tax History
| Year | Tax Paid | Tax Assessment Tax Assessment Total Assessment is a certain percentage of the fair market value that is determined by local assessors to be the total taxable value of land and additions on the property. | Land | Improvement |
|---|---|---|---|---|
| 2024 | $3,200 | $276,300 | $87,600 | $188,700 |
| 2023 | $3,200 | $286,500 | $96,000 | $190,500 |
| 2022 | $2,892 | $256,900 | $84,800 | $172,100 |
| 2021 | $2,748 | $227,200 | $75,000 | $152,200 |
| 2020 | $2,628 | $219,400 | $75,000 | $144,400 |
| 2019 | $2,726 | $206,900 | $60,000 | $146,900 |
| 2018 | $2,458 | $206,400 | $71,900 | $134,500 |
| 2017 | $2,212 | $185,100 | $58,500 | $126,600 |
| 2016 | $2,296 | $171,200 | $52,000 | $119,200 |
| 2015 | $2,048 | $149,600 | $39,300 | $110,300 |
| 2013 | -- | $111,800 | $24,700 | $87,100 |
Source: Public Records
Map
Nearby Homes
- 3214 Juniper Cir Unit D
- 3214 Juniper Cir Unit C
- 3212 Juniper Cir Unit F
- 8457 Savanna Oaks Ln
- 8471 Savanna Oaks Ln
- 8525 Savanna Oaks Ln
- 3208 Juniper Cir Unit A
- 3392 N View Ln
- 2639 Oak Ridge Trail
- 8614 Timberwood Rd
- 8918 Springwood Dr
- 8731 Quarry Ridge Ln Unit B
- 8590 Quarry Ridge Ln Unit B
- 8019 Marsh Creek Rd
- 2755 Meadow Brook Dr Unit F
- 7965 Forest Blvd Unit C
- 2655 Wimbledon Dr
- 2297 Timberlea Dr
- 2534 Timberlea Dr
- 2473 Wimbledon Bay
- 3027 Juniper Ln Unit D
- 3027 Juniper Ln Unit F
- 3027 Juniper Ln Unit B
- 3027 Juniper Ln Unit H
- 3027 Juniper Ln Unit A
- 3027 Juniper Ln Unit C
- 3027 Juniper Ln Unit G
- 3027 Juniper Ln
- 3053 Juniper Ln Unit C
- 3053 Juniper Ln Unit E
- 3053 Juniper Ln Unit D
- 3053 Juniper Ln Unit F
- 3053 Juniper Ln Unit A
- 3053 Juniper Ln Unit B
- 3053 Juniper Ln Unit H
- 3001 Juniper Ln Unit C
- 3001 Juniper Ln Unit H
- 3001 Juniper Ln Unit J
- 3001 Juniper Ln Unit A
- 3001 Juniper Ln Unit E