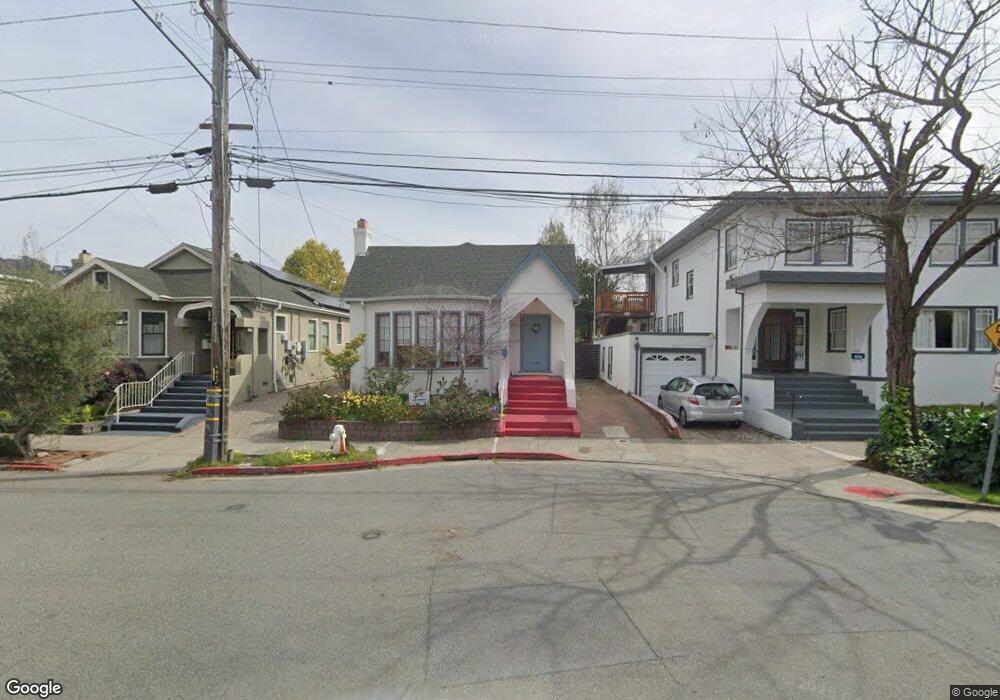
3027 Regent St Berkeley, CA 94705
Elmwood NeighborhoodEstimated Value: $1,604,306 - $2,173,000
3
Beds
2
Baths
1,562
Sq Ft
$1,239/Sq Ft
Est. Value
About This Home
This home is located at 3027 Regent St, Berkeley, CA 94705 and is currently estimated at $1,935,827, approximately $1,239 per square foot. 3027 Regent St is a home located in Alameda County with nearby schools including John Muir Elementary School, Emerson Elementary School, and Malcolm X Elementary School.
Ownership History
Date
Name
Owned For
Owner Type
Purchase Details
Closed on
Nov 6, 2025
Sold by
Abrams Simon-Peter Kirk and Lombardi Jessica Lee
Bought by
Abrams And Lombardi Living Trust and Abrams
Current Estimated Value
Purchase Details
Closed on
Apr 22, 2014
Sold by
Abrams Simon Peter Kirk
Bought by
Abrams Simon Peter Kirk and Lombardi Jessica Lee
Home Financials for this Owner
Home Financials are based on the most recent Mortgage that was taken out on this home.
Original Mortgage
$275,000
Interest Rate
4.32%
Mortgage Type
New Conventional
Purchase Details
Closed on
May 19, 2006
Sold by
Abrams Rebecca and Abrams Family Trust
Bought by
Abrams Simon Peter Kirk
Purchase Details
Closed on
Mar 10, 2006
Sold by
Abrams Rebecca and The Abrams Family Trust
Bought by
Abrams Rebecca and Bypass Trust
Purchase Details
Closed on
Aug 14, 2000
Sold by
Abrams Melvin S and Abrams Oleta K
Bought by
Abrams Melvin S and Abrams Oleta Kirk
Create a Home Valuation Report for This Property
The Home Valuation Report is an in-depth analysis detailing your home's value as well as a comparison with similar homes in the area
Home Values in the Area
Average Home Value in this Area
Purchase History
| Date | Buyer | Sale Price | Title Company |
|---|---|---|---|
| Abrams And Lombardi Living Trust | -- | None Listed On Document | |
| Abrams Simon-Peter Kirk | -- | None Listed On Document | |
| Abrams Simon Peter Kirk | -- | Placer Title Company | |
| Abrams Simon Peter Kirk | -- | None Available | |
| Abrams Rebecca | -- | None Available | |
| Abrams Melvin S | -- | -- |
Source: Public Records
Mortgage History
| Date | Status | Borrower | Loan Amount |
|---|---|---|---|
| Previous Owner | Abrams Simon Peter Kirk | $275,000 |
Source: Public Records
Tax History
| Year | Tax Paid | Tax Assessment Tax Assessment Total Assessment is a certain percentage of the fair market value that is determined by local assessors to be the total taxable value of land and additions on the property. | Land | Improvement |
|---|---|---|---|---|
| 2025 | $7,936 | $332,332 | $126,900 | $205,432 |
| 2024 | $7,936 | $325,816 | $124,412 | $201,404 |
| 2023 | $8,912 | $319,428 | $121,973 | $197,455 |
| 2022 | $6,471 | $313,165 | $119,581 | $193,584 |
| 2021 | $6,457 | $307,026 | $117,237 | $189,789 |
| 2020 | $6,026 | $303,878 | $116,035 | $187,843 |
| 2019 | $6,905 | $297,920 | $113,760 | $184,160 |
| 2018 | $6,744 | $292,080 | $111,530 | $180,550 |
| 2017 | $6,494 | $286,353 | $109,343 | $177,010 |
| 2016 | $7,328 | $280,739 | $107,199 | $173,540 |
| 2015 | $5,951 | $276,522 | $105,589 | $170,933 |
| 2014 | $5,840 | $273,057 | $103,521 | $169,536 |
Source: Public Records
Map
Nearby Homes
- 2477 Prince St
- 6446 Colby St
- 2935 Florence St
- 2917 Telegraph Ave
- 360 Alcatraz Ave
- 2962 Piedmont Ave
- 2243 Ashby Ave
- 2643 Stuart St
- 3046 Deakin St
- 2817 Palm Ct
- 2702 Dana St
- 2923 Wheeler St
- 556 Alcatraz Ave
- 2319 Ward St
- 629 66th St
- 2124 Prince St
- 2110 Ashby Ave
- 6100 Chabot Rd
- 2632 Warring St Unit 2
- 2601 College Ave Unit 203
- 3025 Regent St
- 3029 Regent St
- 3030 Bateman St
- 3021 Regent St
- 3032 Bateman St
- 3020 Bateman St
- 3017 Regent St
- 3027 Bateman St
- 3025 Bateman St
- 3031 Bateman St
- 3015 Regent St
- 2509 Prince St
- 3035 Bateman St
- 2501 Prince St Unit 2
- 2501 Prince St
- 3016 Bateman St
- 3041 Regent St
- 3021 Bateman St
- 3067 Bateman St
- 3011 Regent St
Your Personal Tour Guide
Ask me questions while you tour the home.