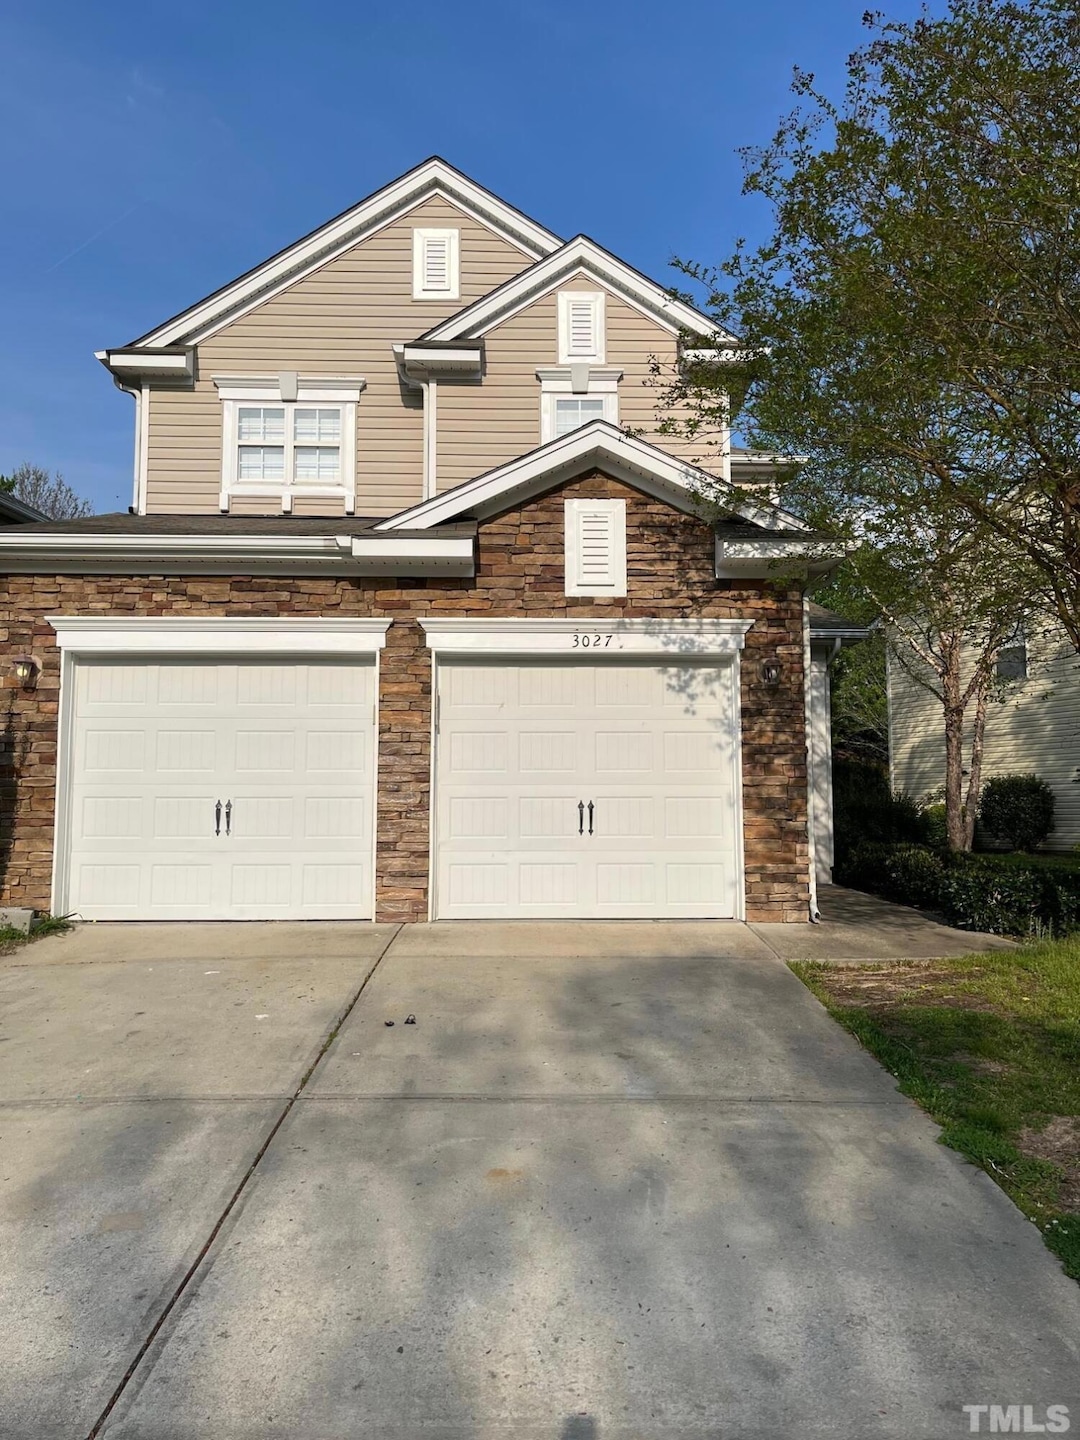
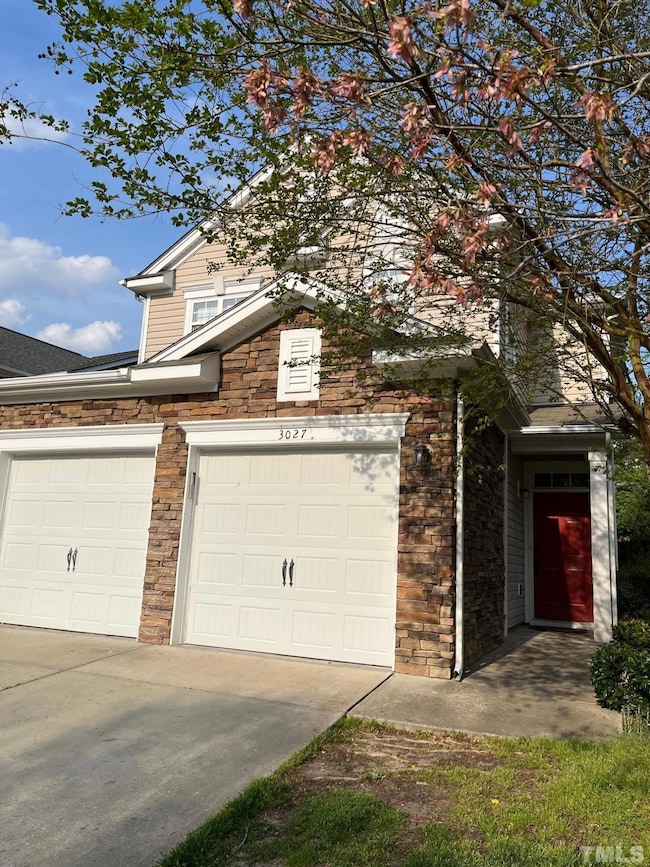
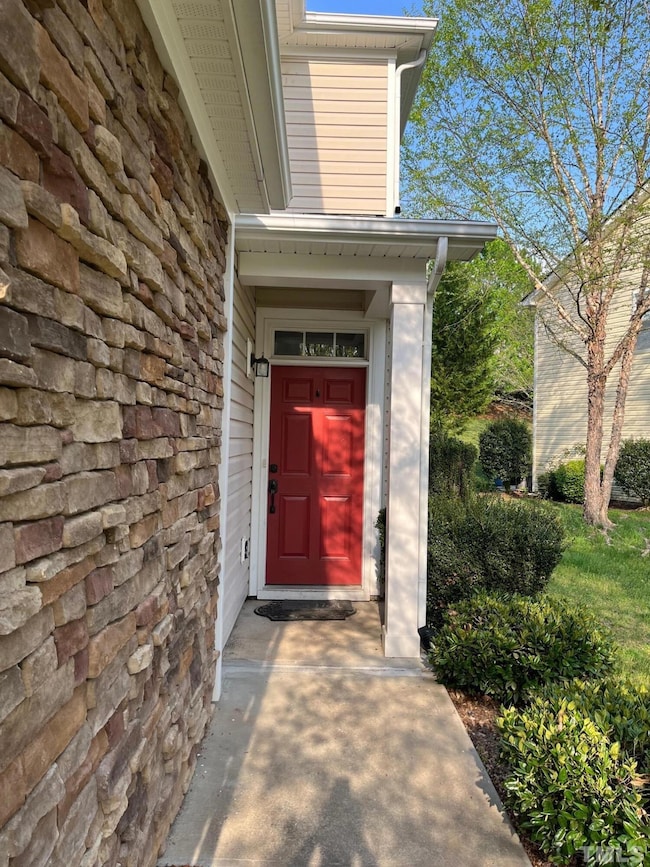
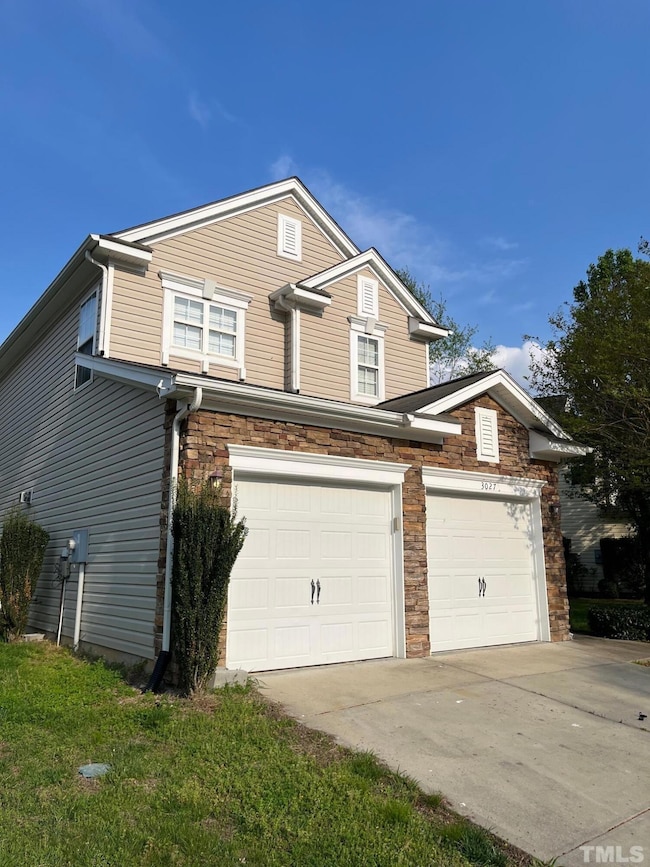
3027 Remington Oaks Cir Cary, NC 27519
Cary Park NeighborhoodHighlights
- Main Floor Primary Bedroom
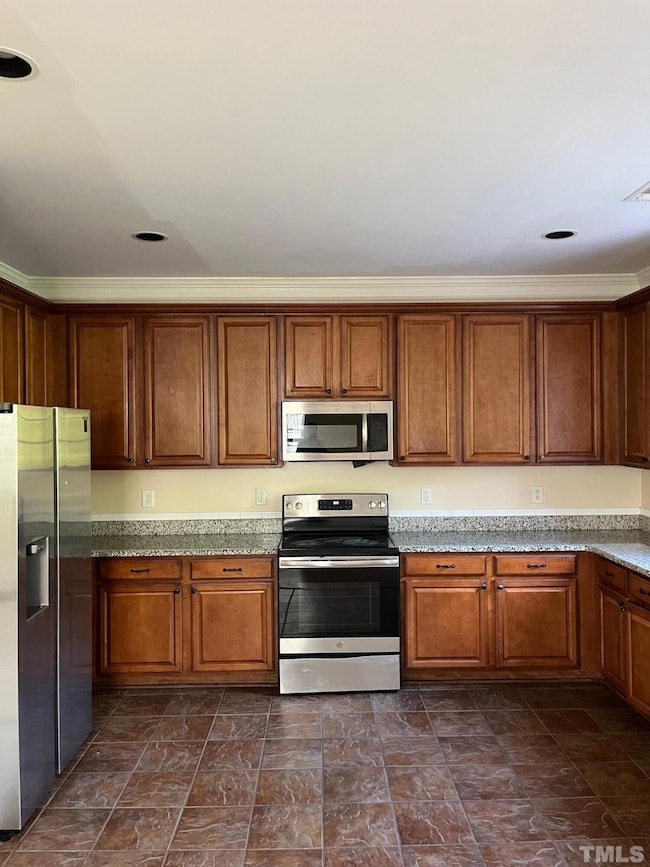
- Granite Countertops
- 2 Car Attached Garage
- Hortons Creek Elementary Rated A
- No HOA
- Central Air
About This Home
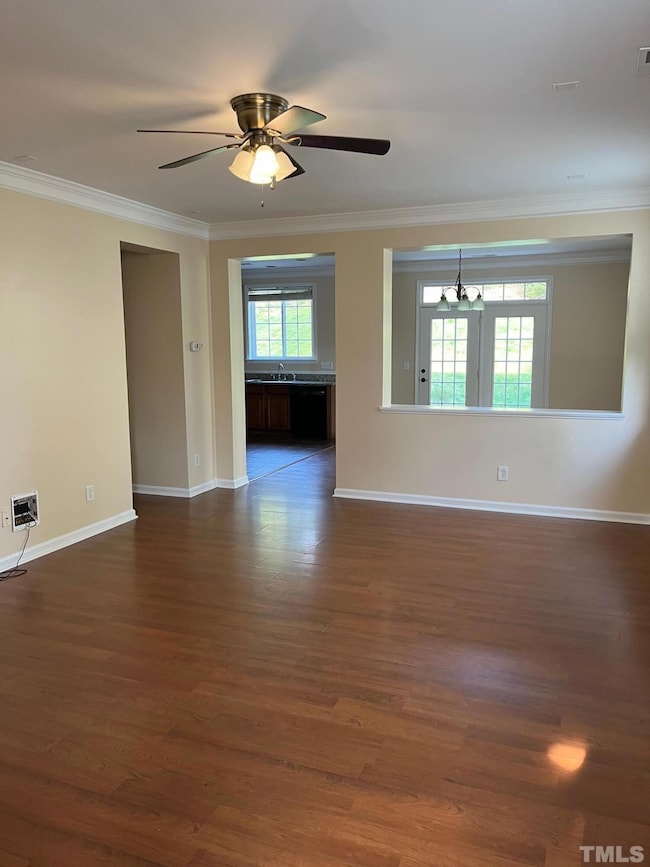
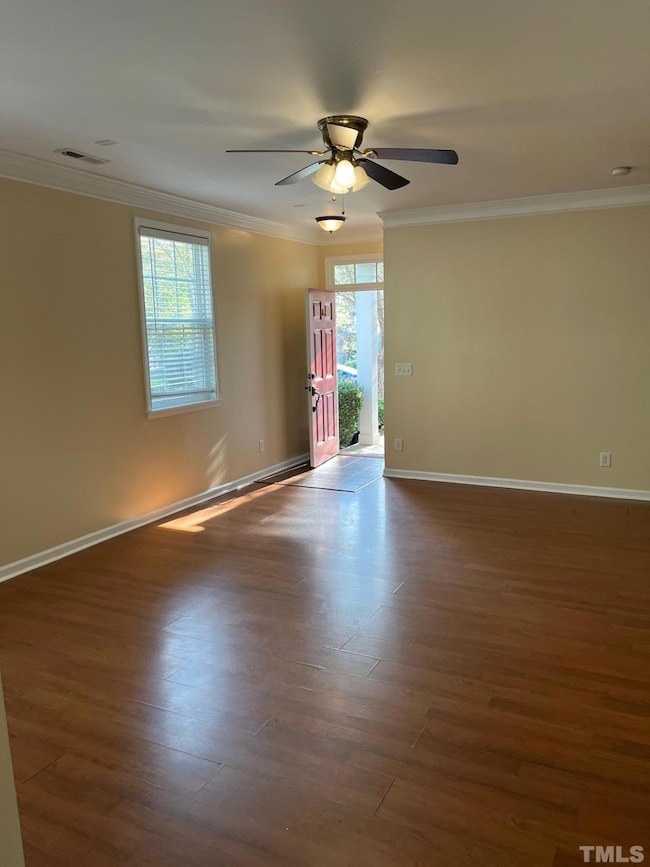
Welcome Home!! Pristine Single family home in a prestigious Amberly neighborhood. Easy drive to RTP and & RDU, Minutes to 540 & nearby shopping. HW floor, Tall cabinets, Granite counter top in Kitchen and much more. Huge Family room. Kitchen overlooking dining area. Master suite with walk-in closets. Great size loft for office space/entertainment. Excellent HOA amenities. A MUST SEE!!
Home Details
Home Type
- Single Family
Est. Annual Taxes
- $4,145
Year Built
- Built in 2006
Lot Details
- 4,356 Sq Ft Lot
Parking
- 2 Car Attached Garage
- Private Driveway
- 2 Open Parking Spaces
Interior Spaces
- 1,820 Sq Ft Home
- 2-Story Property
Kitchen
- Microwave
- Granite Countertops
Flooring
- Carpet
- Vinyl
Bedrooms and Bathrooms
- 3 Bedrooms
- Primary Bedroom on Main
Laundry
- Laundry in unit
- Washer Hookup
Schools
- Hortons Creek Elementary School
- Mills Park Middle School
- Panther Creek High School
Utilities
- Central Air
- Heating System Uses Natural Gas
Listing and Financial Details
- Security Deposit $2,095
- Property Available on 7/19/25
- Tenant pays for all utilities, cable TV, electricity, sewer, trash collection, water
- $80 Application Fee
Community Details
Overview
- No Home Owners Association
- Lexington Park At Amberly Subdivision
Pet Policy
- Pets Allowed
- Pet Deposit $500
- $50 Pet Fee
Map
Source: Doorify MLS
MLS Number: 10110484
APN: 0725.03-44-8074-000
Disclaimer: Certain information contained herein is derived from information provided by parties other than Homes.com. All information provided is deemed reliable, but is not guaranteed to be accurate and should be independently verified.
![]() Some IDX listings have been excluded from this IDX display. Brokers make an effort to deliver accurate information, but buyers should independently verify any information on which they will rely in a transaction. The listing broker shall not be responsible for any typographical errors, misinformation, or misprints, and they shall be held totally harmless from any damages arising from reliance upon this data. This data is provided exclusively for consumers’ personal, non-commercial use. Listings marked with an icon are provided courtesy of the Doorify MLS, Inc. of North Carolina, Internet Data Exchange Database. Closed (sold) listings may have been listed and/or sold by a real estate firm other than the firm(s) featured on this website. Closed data is not available until the sale of the property is recorded in the MLS. Home sale data is not an appraisal, CMA, competitive or comparative market analysis, or home valuation of any property. Copyright 2025 Doorify MLS, Inc. of North Carolina. All rights reserved.
Some IDX listings have been excluded from this IDX display. Brokers make an effort to deliver accurate information, but buyers should independently verify any information on which they will rely in a transaction. The listing broker shall not be responsible for any typographical errors, misinformation, or misprints, and they shall be held totally harmless from any damages arising from reliance upon this data. This data is provided exclusively for consumers’ personal, non-commercial use. Listings marked with an icon are provided courtesy of the Doorify MLS, Inc. of North Carolina, Internet Data Exchange Database. Closed (sold) listings may have been listed and/or sold by a real estate firm other than the firm(s) featured on this website. Closed data is not available until the sale of the property is recorded in the MLS. Home sale data is not an appraisal, CMA, competitive or comparative market analysis, or home valuation of any property. Copyright 2025 Doorify MLS, Inc. of North Carolina. All rights reserved.
- 3033 Remington Oaks Cir
- 3010 Remington Oaks Cir
- 520 Camden Yards Way
- 1742 Whirlaway Ct
- 214 Ashdown Forest Ln
- 106 Painted Turtle Ln
- 109 Longchamp Ln
- 730 Toms Creek Rd
- 1804 Amberly Ledge Way
- 633 Rolling Springs Dr
- 621 Aylestone Dr
- 923 Peltier Dr
- 237 Northlands Dr
- 1089 Queensdale Dr
- 208 Cecelia Ct
- 1034 Ventnor Place
- 1121 Brookhill Way
- 1141 Brookhill Way
- 805 Alden Bridge Dr
- 518 Emerald Downs Rd
- 2018 Remington Oaks Cir
- 305 Longchamp Ln
- 201 Northlands Dr
- 550 Balsam Fir Dr
- 5508 Cary Glen Blvd
- 2000 Cary Reserve Dr
- 528 Fumagalli Dr
- 4545 Cary Glen Blvd
- 1427 Glenwater Dr
- 723 Crimson Sage Ln
- 4000 Brushy Mountain St
- 1531 Glenwater Dr
- 506 Catalina Grande Dr
- 977 Bristol Bridge Dr
- 1653 Cary Reserve Dr
- 648 Catalina Grande Dr
- 1540 Glenwater Dr
- 228 Dove Cottage Ln
- 2343 Pindos Dr
- 804 Greystone Crest Way
