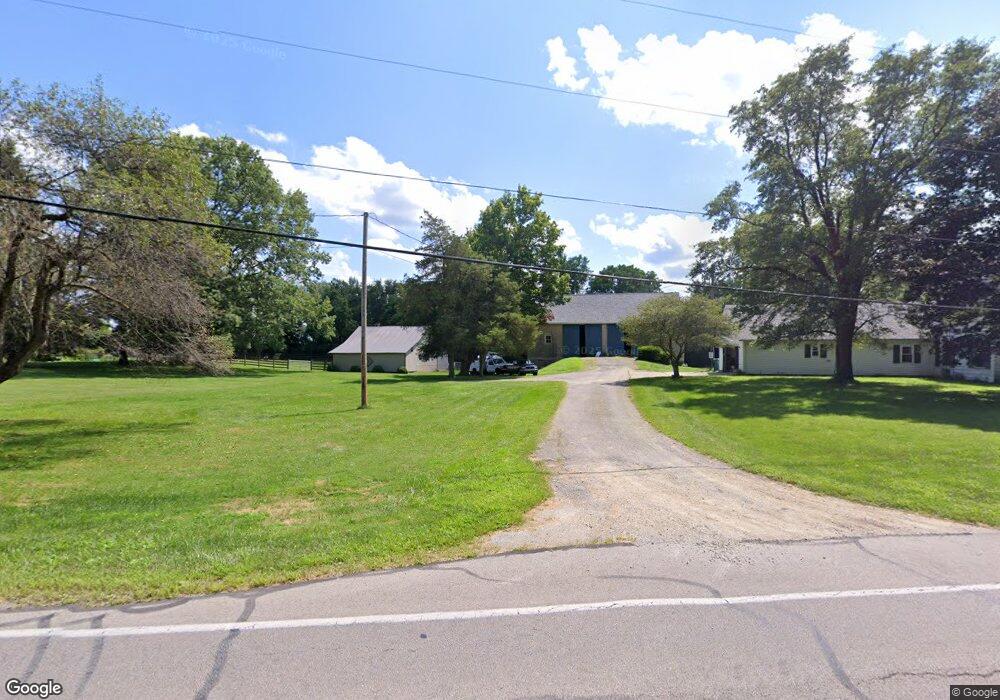
3027 Upper Bellbrook Rd Bellbrook, OH 45305
Estimated Value: $359,000 - $490,000
4
Beds
2
Baths
2,376
Sq Ft
$172/Sq Ft
Est. Value
About This Home
This home is located at 3027 Upper Bellbrook Rd, Bellbrook, OH 45305 and is currently estimated at $408,130, approximately $171 per square foot. 3027 Upper Bellbrook Rd is a home located in Greene County with nearby schools including Bell Creek Intermediate School, Stephen Bell Elementary School, and Bellbrook Middle School.
Ownership History
Date
Name
Owned For
Owner Type
Purchase Details
Closed on
Nov 18, 2014
Sold by
Foreman Family Enterprises Llc
Bought by
Vincent Mark D and Vincent Pixie A
Current Estimated Value
Home Financials for this Owner
Home Financials are based on the most recent Mortgage that was taken out on this home.
Original Mortgage
$162,011
Outstanding Balance
$123,461
Interest Rate
4.25%
Mortgage Type
FHA
Estimated Equity
$284,669
Purchase Details
Closed on
Dec 1, 2010
Sold by
Sugar Valley Country Club
Bought by
Foreman Family Enterprises Llc
Purchase Details
Closed on
Aug 5, 1997
Sold by
Thomas Margie J
Bought by
Sugar Valley Country Club
Home Financials for this Owner
Home Financials are based on the most recent Mortgage that was taken out on this home.
Original Mortgage
$128,000
Interest Rate
7.71%
Mortgage Type
New Conventional
Create a Home Valuation Report for This Property
The Home Valuation Report is an in-depth analysis detailing your home's value as well as a comparison with similar homes in the area
Home Values in the Area
Average Home Value in this Area
Purchase History
| Date | Buyer | Sale Price | Title Company |
|---|---|---|---|
| Vincent Mark D | $165,000 | None Available | |
| Foreman Family Enterprises Llc | -- | Attorney | |
| Sugar Valley Country Club | $178,000 | -- |
Source: Public Records
Mortgage History
| Date | Status | Borrower | Loan Amount |
|---|---|---|---|
| Open | Vincent Mark D | $162,011 | |
| Previous Owner | Sugar Valley Country Club | $128,000 |
Source: Public Records
Tax History
| Year | Tax Paid | Tax Assessment Tax Assessment Total Assessment is a certain percentage of the fair market value that is determined by local assessors to be the total taxable value of land and additions on the property. | Land | Improvement |
|---|---|---|---|---|
| 2025 | $5,930 | $105,120 | $33,090 | $72,030 |
| 2024 | $5,930 | $105,120 | $33,090 | $72,030 |
| 2023 | $5,826 | $105,120 | $33,090 | $72,030 |
| 2022 | $6,169 | $92,630 | $33,090 | $59,540 |
| 2021 | $6,239 | $92,630 | $33,090 | $59,540 |
| 2020 | $5,829 | $92,630 | $33,090 | $59,540 |
| 2019 | $6,095 | $88,860 | $33,090 | $55,770 |
| 2018 | $6,105 | $88,860 | $33,090 | $55,770 |
| 2017 | $5,955 | $88,860 | $33,090 | $55,770 |
| 2016 | $6,039 | $85,240 | $33,090 | $52,150 |
| 2015 | $5,943 | $85,240 | $33,090 | $52,150 |
| 2014 | $5,611 | $85,240 | $33,090 | $52,150 |
Source: Public Records
Map
Nearby Homes
- 1374 Rose Lake Dr
- 1399 Heritage Trace Ct
- 40 Deerpath Cir
- 3608 Cypress Pointe Dr
- 3604 Cypress Pointe Dr
- 3613 Cypress Pointe Dr
- 3605 Cypress Pointe Dr
- 2488 Stewart Rd
- 3656 Persimmon Ridge Place
- 208 Pinegrove Dr
- 3634 Marwood Dr
- 1478 Country Wood Dr
- 3870 Feather Heights Ct
- 45 N East St Unit 45
- 1667 Ardennes Oak Dr
- 3617 Shellbark Dr
- 3553 Shellbark Dr
- 42 Deerpath Cir
- 5640 Winshire Terrace
- 252 Signature Dr S
- 3036 Upper Bellbrook Rd
- 3001 Upper Bellbrook Rd
- 3001 Upper Bellbrook Rd
- 1121 Berryhill Rd
- 3056 Upper Bellbrook Rd
- 3056 Upper Bellbrook Rd
- 1120 Berryhill Rd
- 1140 Mcbee Rd
- 1128 Mcbee Rd
- 1107 Berryhill Rd
- 1158 Settlers Bay Ct
- 1106 Mcbee Rd
- 1096 Berryhill Rd
- 1093 Berryhill Rd
- 1162 Settlers Bay Ct
- 2987 Upper Bellbrook Rd
- 1157 Mcbee Rd
- 1079 Berryhill Rd
- 1166 Settlers Bay Ct
- 1133 Mcbee Rd
Your Personal Tour Guide
Ask me questions while you tour the home.