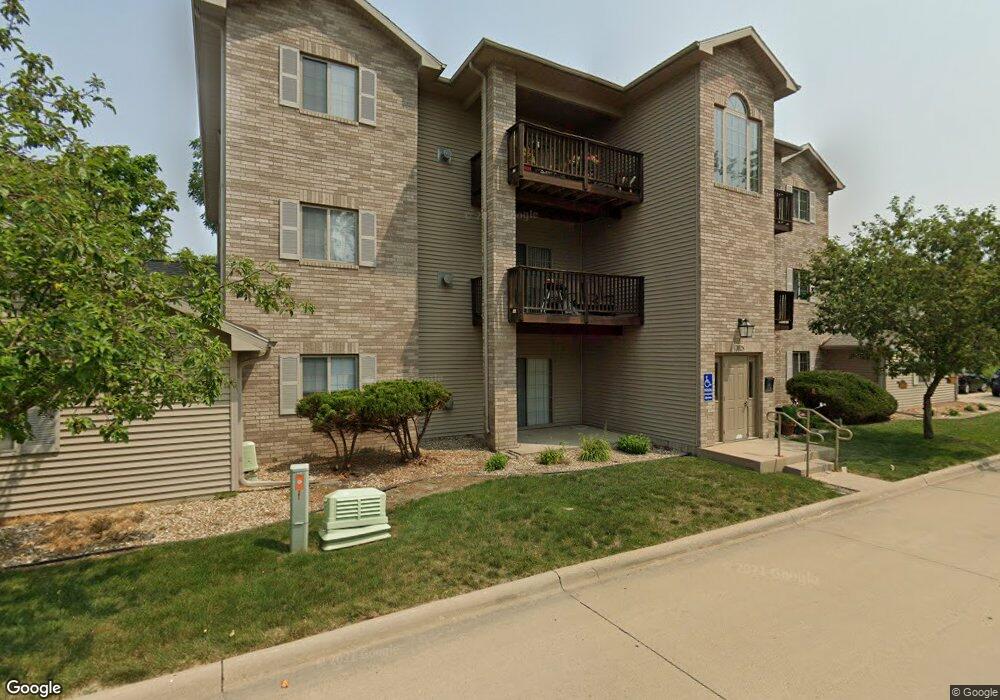
3028 Center Point Rd NE Cedar Rapids, IA 52402
Noelridge Park NeighborhoodEstimated Value: $101,501 - $109,000
2
Beds
1
Bath
900
Sq Ft
$118/Sq Ft
Est. Value
About This Home
This home is located at 3028 Center Point Rd NE, Cedar Rapids, IA 52402 and is currently estimated at $106,375, approximately $118 per square foot. 3028 Center Point Rd NE is a home located in Linn County with nearby schools including Garfield Elementary School, Franklin Middle School, and George Washington High School.
Ownership History
Date
Name
Owned For
Owner Type
Purchase Details
Closed on
Jul 31, 2018
Sold by
Watson Danny L and Watson Alice E
Bought by
Watson Danny L and Watson Alice E
Current Estimated Value
Purchase Details
Closed on
Feb 19, 2016
Sold by
Federal National Mortgage Association
Bought by
Watson Danny L
Purchase Details
Closed on
Jul 13, 2015
Sold by
Nationwide Advantage Mortgage Co
Bought by
Federal National Mortgage Association
Purchase Details
Closed on
Jul 1, 2015
Sold by
Campbell William P
Bought by
Nationwide Advantage Mortgage Co
Purchase Details
Closed on
Jul 30, 2004
Sold by
Frantz Chael Construction Lc
Bought by
Campbell William P
Home Financials for this Owner
Home Financials are based on the most recent Mortgage that was taken out on this home.
Original Mortgage
$79,400
Interest Rate
6.34%
Mortgage Type
Purchase Money Mortgage
Create a Home Valuation Report for This Property
The Home Valuation Report is an in-depth analysis detailing your home's value as well as a comparison with similar homes in the area
Home Values in the Area
Average Home Value in this Area
Purchase History
| Date | Buyer | Sale Price | Title Company |
|---|---|---|---|
| Watson Danny L | -- | None Available | |
| Watson Danny L | -- | None Available | |
| Federal National Mortgage Association | -- | None Available | |
| Nationwide Advantage Mortgage Co | -- | None Available | |
| Campbell William P | $81,500 | -- |
Source: Public Records
Mortgage History
| Date | Status | Borrower | Loan Amount |
|---|---|---|---|
| Previous Owner | Campbell William P | $79,400 |
Source: Public Records
Tax History Compared to Growth
Tax History
| Year | Tax Paid | Tax Assessment Tax Assessment Total Assessment is a certain percentage of the fair market value that is determined by local assessors to be the total taxable value of land and additions on the property. | Land | Improvement |
|---|---|---|---|---|
| 2025 | $1,146 | $106,800 | $16,500 | $90,300 |
| 2024 | $1,574 | $90,900 | $12,000 | $78,900 |
| 2023 | $1,574 | $90,900 | $12,000 | $78,900 |
| 2022 | $1,480 | $86,900 | $12,000 | $74,900 |
| 2021 | $1,534 | $83,800 | $12,000 | $71,800 |
| 2020 | $1,534 | $81,400 | $12,000 | $69,400 |
| 2019 | $1,458 | $79,400 | $12,000 | $67,400 |
| 2018 | $1,460 | $79,400 | $12,000 | $67,400 |
| 2017 | $1,528 | $81,900 | $6,000 | $75,900 |
| 2016 | $1,523 | $75,000 | $6,000 | $69,000 |
| 2015 | $1,338 | $75,112 | $6,000 | $69,112 |
| 2014 | $1,342 | $75,112 | $6,000 | $69,112 |
| 2013 | -- | $75,112 | $6,000 | $69,112 |
Source: Public Records
Map
Nearby Homes
- 3028 Center Point Rd NE Unit 202
- 3050 Center Point Rd NE
- 2906 Oakland Rd NE
- 2935 Wildwood Ct NE
- 1721 34th St NE
- 2962 Circle Dr NE
- 3008 Circle Hill Ct NE
- 1230 30th St NE
- 1231 33rd St NE
- 1611 Hollywood Blvd NE
- 2041 Birchwood Dr NE
- 1126 32nd St NE
- 1222 35th St NE
- 1134 Center St NE
- 3704 Richmond Rd NE
- 3711 Oakland Rd NE
- 1115 27th St NE
- 1114 35th St NE
- 2113 Linmar Dr NE
- 1051 35th St NE
- 3028 Center Pt Rd NE Unit 303
- 3028 Center Pt Rd NE Unit 302
- 3028 Center Pt Rd NE Unit 301
- 3028 Center Point Rd NE
- 3028 Center Pt Rd NE Unit 203
- 3028 Center Pt Rd NE Unit 202
- 3028 Center Pt Rd NE Unit 201
- 3028 Center Pt Rd NE Unit 104
- 3028 Center Pt Rd NE Unit 103
- 3028 Center Point Rd NE
- 3028 Center Pt Rd NE Unit 304
- 3028 Center Point Rd NE Unit 103
- 3028 Center Point Rd NE Unit 101
- 3028 Center Point Rd NE Unit 102
- 3028 Center Point Rd NE Unit 302
- 3028 Center Point Rd NE Unit 203
- 3016 Center Point Rd NE
- 3010 Center Point Rd NE
- 3004 Center Point Rd NE
- 3023 Center Point Rd NE