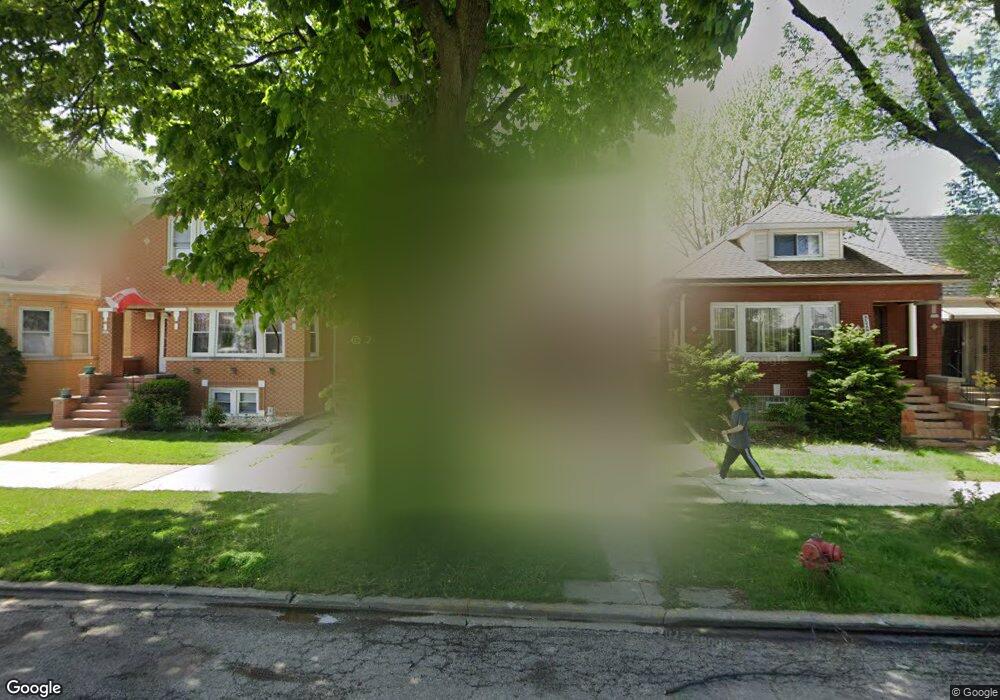
3028 N Linder Ave Chicago, IL 60641
Cragin NeighborhoodEstimated Value: $343,000 - $423,000
3
Beds
1
Bath
1,120
Sq Ft
$341/Sq Ft
Est. Value
About This Home
This home is located at 3028 N Linder Ave, Chicago, IL 60641 and is currently estimated at $381,395, approximately $340 per square foot. 3028 N Linder Ave is a home located in Cook County with nearby schools including Camras Elementary School, Foreman College and Career Academy, and Horizon Science Academy-Belmont.
Ownership History
Date
Name
Owned For
Owner Type
Purchase Details
Closed on
May 24, 2007
Sold by
Flanagan Sean and Flanagan Kim
Bought by
Bonilla Orlando
Current Estimated Value
Home Financials for this Owner
Home Financials are based on the most recent Mortgage that was taken out on this home.
Original Mortgage
$232,400
Outstanding Balance
$141,593
Interest Rate
6.2%
Mortgage Type
Unknown
Estimated Equity
$239,802
Purchase Details
Closed on
Jul 17, 2000
Sold by
Hanan Ida J
Bought by
Flanagan Sean and Przybylski Kim
Home Financials for this Owner
Home Financials are based on the most recent Mortgage that was taken out on this home.
Original Mortgage
$150,000
Interest Rate
8.12%
Purchase Details
Closed on
Jan 8, 2000
Sold by
Hanan Ida J
Bought by
Ida J Hanan Trust
Create a Home Valuation Report for This Property
The Home Valuation Report is an in-depth analysis detailing your home's value as well as a comparison with similar homes in the area
Home Values in the Area
Average Home Value in this Area
Purchase History
| Date | Buyer | Sale Price | Title Company |
|---|---|---|---|
| Bonilla Orlando | $310,000 | First American Title | |
| Flanagan Sean | $170,000 | -- | |
| Ida J Hanan Trust | -- | -- | |
| Ida J Hanan Trust | -- | -- |
Source: Public Records
Mortgage History
| Date | Status | Borrower | Loan Amount |
|---|---|---|---|
| Open | Bonilla Orlando | $232,400 | |
| Previous Owner | Flanagan Sean | $150,000 |
Source: Public Records
Tax History Compared to Growth
Tax History
| Year | Tax Paid | Tax Assessment Tax Assessment Total Assessment is a certain percentage of the fair market value that is determined by local assessors to be the total taxable value of land and additions on the property. | Land | Improvement |
|---|---|---|---|---|
| 2024 | $5,212 | $30,000 | $6,993 | $23,007 |
| 2023 | $5,059 | $28,000 | $5,670 | $22,330 |
| 2022 | $5,059 | $28,000 | $5,670 | $22,330 |
| 2021 | $4,964 | $28,003 | $5,673 | $22,330 |
| 2020 | $4,190 | $21,900 | $4,725 | $17,175 |
| 2019 | $4,257 | $24,607 | $4,725 | $19,882 |
| 2018 | $4,185 | $24,607 | $4,725 | $19,882 |
| 2017 | $3,868 | $21,335 | $4,158 | $17,177 |
| 2016 | $3,775 | $21,335 | $4,158 | $17,177 |
| 2015 | $3,431 | $21,335 | $4,158 | $17,177 |
| 2014 | $3,360 | $20,666 | $3,780 | $16,886 |
| 2013 | $3,761 | $20,666 | $3,780 | $16,886 |
Source: Public Records
Map
Nearby Homes
- 3036 N Long Ave
- 3036 N Luna Ave
- 5534 W Barry Ave
- 2939 N Lotus Ave
- 5335 W Barry Ave
- 5435 W Melrose St
- 5244 W Barry Ave
- 5303 W George St
- 5243 W Oakdale Ave
- 5434 W School St
- 5254 W Wolfram St
- 3043 N Laramie Ave Unit 2
- 3045 N Laramie Ave Unit 2
- 2859 N Mango Ave
- 5505 W Parker Ave
- 4918-22 W Diversey Ave
- 2735 N Mango Ave
- 5233 W Parker Ave
- 5042 W Wellington Ave
- 5330 W Drummond Place
- 3030 N Linder Ave
- 3024 N Linder Ave Unit 2
- 3022 N Linder Ave
- 3034 N Linder Ave
- 3036 N Linder Ave
- 3018 N Linder Ave
- 3040 N Linder Ave
- 3016 N Linder Ave
- 3029 N Luna Ave
- 3031 N Luna Ave
- 3042 N Linder Ave
- 3014 N Linder Ave
- 3023 N Luna Ave
- 3035 N Luna Ave
- 3025 N Luna Ave
- 3037 N Luna Ave
- 3046 N Linder Ave
- 3019 N Luna Ave
- 3010 N Linder Ave
- 3041 N Luna Ave