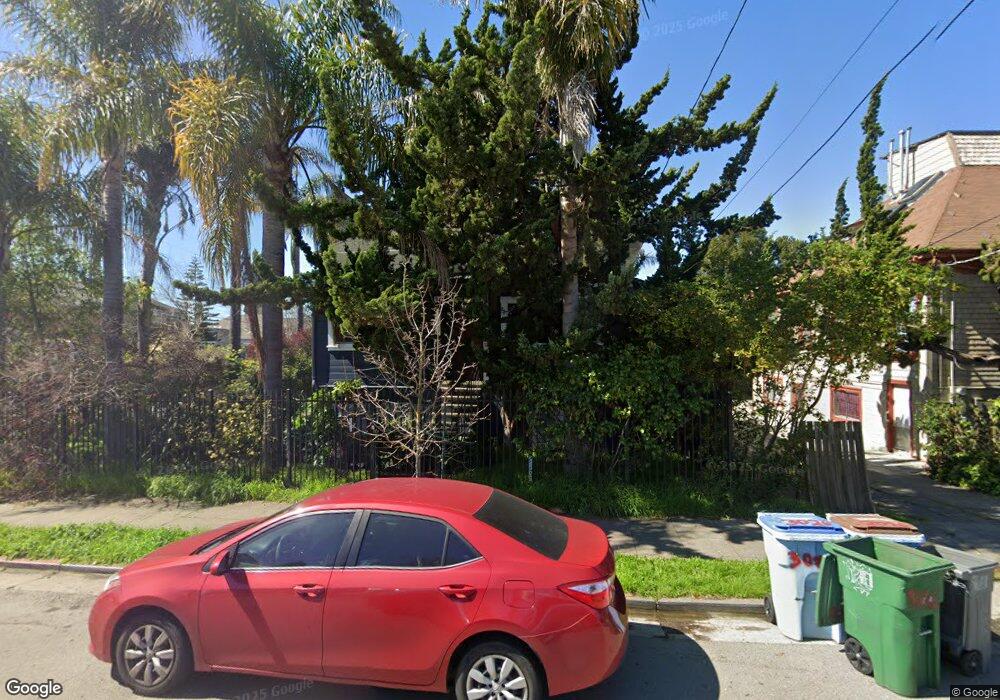
3028 Shattuck Ave Berkeley, CA 94705
South Berkeley NeighborhoodEstimated Value: $938,000 - $1,263,000
3
Beds
1
Bath
1,084
Sq Ft
$1,009/Sq Ft
Est. Value
About This Home
This home is located at 3028 Shattuck Ave, Berkeley, CA 94705 and is currently estimated at $1,093,710, approximately $1,008 per square foot. 3028 Shattuck Ave is a home located in Alameda County with nearby schools including Malcolm X Elementary School, Emerson Elementary School, and John Muir Elementary School.
Ownership History
Date
Name
Owned For
Owner Type
Purchase Details
Closed on
Jun 21, 2023
Sold by
Servan-Schreiber Jason and Servan-Schreiber Camille
Bought by
Jason Cohn And Camille Servan-Schreiber Revoc and Cohn
Current Estimated Value
Purchase Details
Closed on
Dec 26, 2007
Sold by
Cohn Jason A and Servan Schreiber Camille
Bought by
Cohn Jason and Servan Schreiber Camille
Purchase Details
Closed on
Jan 5, 2004
Sold by
Onisko Byron and Wood Susan T
Bought by
Cohn Jason A and Servan Schreiber Camille
Home Financials for this Owner
Home Financials are based on the most recent Mortgage that was taken out on this home.
Original Mortgage
$300,000
Interest Rate
5.88%
Mortgage Type
Purchase Money Mortgage
Purchase Details
Closed on
Jul 7, 2000
Sold by
Sawle David R
Bought by
Onisko Byron and Wood Susan T
Home Financials for this Owner
Home Financials are based on the most recent Mortgage that was taken out on this home.
Original Mortgage
$229,500
Interest Rate
8.63%
Create a Home Valuation Report for This Property
The Home Valuation Report is an in-depth analysis detailing your home's value as well as a comparison with similar homes in the area
Home Values in the Area
Average Home Value in this Area
Purchase History
| Date | Buyer | Sale Price | Title Company |
|---|---|---|---|
| Jason Cohn And Camille Servan-Schreiber Revoc | -- | None Listed On Document | |
| Cohn Jason | -- | None Available | |
| Cohn Jason A | $470,000 | First California Title Co | |
| Onisko Byron | $255,000 | Placer Title Company |
Source: Public Records
Mortgage History
| Date | Status | Borrower | Loan Amount |
|---|---|---|---|
| Previous Owner | Cohn Jason A | $300,000 | |
| Previous Owner | Onisko Byron | $229,500 |
Source: Public Records
Tax History
| Year | Tax Paid | Tax Assessment Tax Assessment Total Assessment is a certain percentage of the fair market value that is determined by local assessors to be the total taxable value of land and additions on the property. | Land | Improvement |
|---|---|---|---|---|
| 2025 | $11,681 | $661,203 | $200,461 | $467,742 |
| 2024 | $11,681 | $648,104 | $196,531 | $458,573 |
| 2023 | $11,418 | $635,258 | $192,677 | $449,581 |
| 2022 | $11,173 | $622,667 | $188,900 | $440,767 |
| 2021 | $11,174 | $610,325 | $185,197 | $432,128 |
| 2020 | $10,480 | $611,000 | $183,300 | $427,700 |
| 2019 | $9,966 | $599,018 | $179,705 | $419,313 |
| 2018 | $9,774 | $587,274 | $176,182 | $411,092 |
| 2017 | $9,423 | $575,758 | $172,727 | $403,031 |
| 2016 | $9,053 | $564,470 | $169,341 | $395,129 |
| 2015 | $8,920 | $555,990 | $166,797 | $389,193 |
| 2014 | $8,220 | $500,000 | $150,000 | $350,000 |
Source: Public Records
Map
Nearby Homes
- 2057 Emerson St
- 2110 Ashby Ave
- 2124 Prince St
- 2923 Wheeler St
- 6555 Shattuck Ave
- 629 66th St
- 3046 Deakin St
- 2243 Ashby Ave
- 2926 Ellis St
- 667 & 667A Alcatraz Ave
- 667 Alcatraz Ave
- 6320 Shattuck Ave
- 6445 Irwin Ct
- 6300 Shattuck Ave Unit 1
- 556 Alcatraz Ave
- 1646 Ashby Ave
- 3233 Ellis St
- 2701 Grant St
- 2917 Telegraph Ave
- 2935 Florence St
- 2035 Essex St
- 3022 Shattuck Ave
- 2029 Essex St
- 2034 Essex St
- 3020 Shattuck Ave
- 2080 Emerson St
- 2068 Emerson St
- 2030 Essex St
- 2025 Essex St
- 2064 Emerson St
- 3025 Shattuck Ave
- 3045 Shattuck Ave Unit B
- 3045 Shattuck Ave Unit A
- 2028 Essex St
- 2021 Essex St
- 2026 Essex St
- 3049 Shattuck Ave
- 2024 Essex St
- 3051 Shattuck Ave
- 2048 Emerson St
Your Personal Tour Guide
Ask me questions while you tour the home.