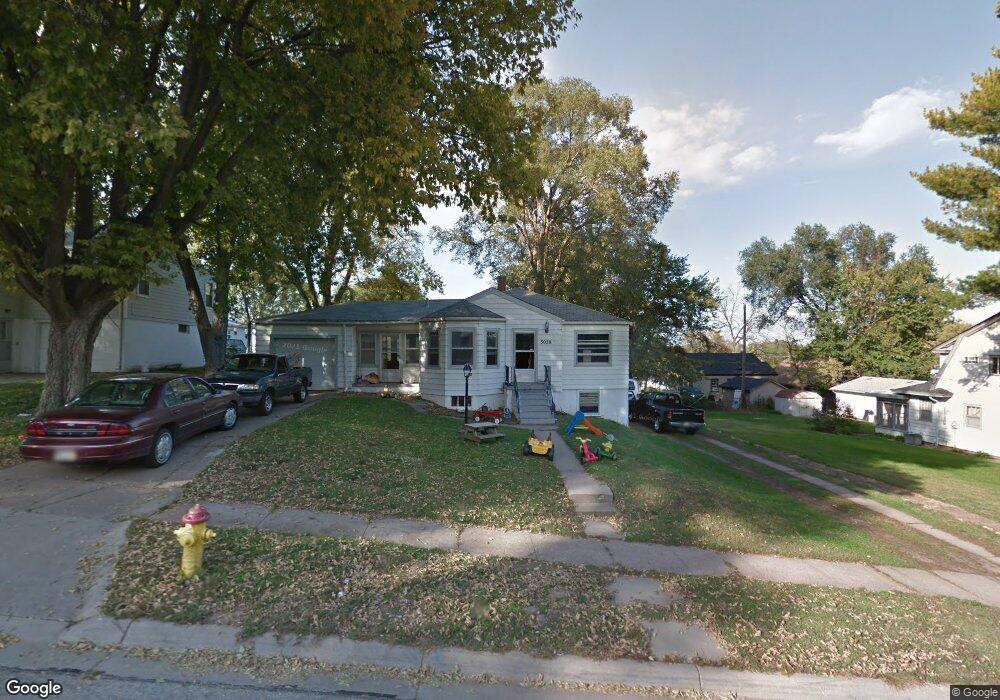
3028 Whitmore St Omaha, NE 68112
Florence NeighborhoodEstimated Value: $174,000 - $200,000
3
Beds
2
Baths
1,554
Sq Ft
$121/Sq Ft
Est. Value
About This Home
This home is located at 3028 Whitmore St, Omaha, NE 68112 and is currently estimated at $188,238, approximately $121 per square foot. 3028 Whitmore St is a home located in Douglas County with nearby schools including Minne Lusa Elementary School, McMillan Middle School, and North High School.
Ownership History
Date
Name
Owned For
Owner Type
Purchase Details
Closed on
Oct 27, 2022
Sold by
Tillisch Jeff and Tillisch Tami
Bought by
Swaitseven Llc
Current Estimated Value
Home Financials for this Owner
Home Financials are based on the most recent Mortgage that was taken out on this home.
Original Mortgage
$278,240
Outstanding Balance
$269,565
Interest Rate
6.92%
Mortgage Type
New Conventional
Estimated Equity
-$81,327
Purchase Details
Closed on
Aug 5, 2011
Sold by
Secretary Of Housing & Urban Development
Bought by
Tillisch Jeffery and Tillisch Tami
Purchase Details
Closed on
Nov 12, 2010
Sold by
U S Bank N A
Bought by
Secretary Of Housing & Urban Development
Purchase Details
Closed on
Aug 27, 2010
Sold by
Bourne Serena A and Bourne Aaron C
Bought by
U S Bank Na
Purchase Details
Closed on
May 23, 2008
Sold by
Dawes Steven
Bought by
Bourne Aaron
Create a Home Valuation Report for This Property
The Home Valuation Report is an in-depth analysis detailing your home's value as well as a comparison with similar homes in the area
Home Values in the Area
Average Home Value in this Area
Purchase History
| Date | Buyer | Sale Price | Title Company |
|---|---|---|---|
| Swaitseven Llc | -- | Dri Title & Escrow | |
| Tillisch Jeffery | -- | None Available | |
| Secretary Of Housing & Urban Development | -- | None Available | |
| U S Bank Na | $93,072 | None Available | |
| Bourne Aaron | $94,000 | -- |
Source: Public Records
Mortgage History
| Date | Status | Borrower | Loan Amount |
|---|---|---|---|
| Open | Swaitseven Llc | $278,240 |
Source: Public Records
Tax History Compared to Growth
Tax History
| Year | Tax Paid | Tax Assessment Tax Assessment Total Assessment is a certain percentage of the fair market value that is determined by local assessors to be the total taxable value of land and additions on the property. | Land | Improvement |
|---|---|---|---|---|
| 2024 | $2,167 | $106,600 | $12,800 | $93,800 |
| 2023 | $2,167 | $102,700 | $12,800 | $89,900 |
| 2022 | $2,192 | $102,700 | $12,800 | $89,900 |
| 2021 | $1,869 | $88,300 | $12,800 | $75,500 |
| 2020 | $1,623 | $75,800 | $12,800 | $63,000 |
| 2019 | $1,507 | $70,200 | $800 | $69,400 |
| 2018 | $1,273 | $59,200 | $800 | $58,400 |
| 2017 | $1,080 | $50,000 | $800 | $49,200 |
| 2016 | $1,099 | $51,200 | $700 | $50,500 |
| 2015 | $1,289 | $60,900 | $5,200 | $55,700 |
| 2014 | $1,289 | $60,900 | $5,200 | $55,700 |
Source: Public Records
Map
Nearby Homes
- 6808 N 30th St
- 3164 Ida St
- 2868 Whitmore St
- 2874 Mary St
- 18701 Martin Ave
- 18613 Martin Ave
- 2881 Mary St
- 2859 Iowa St
- 2730 Whitmore St
- 3041 Scott Cir
- 6514 N 31st Ave
- 2852 Martin Ave
- 2744 Bauman Ave
- 2851 Bauman Ave
- 3304 Redick Ave
- 2851 Sharon Dr
- 7103 Minne Lusa Blvd
- 3325 Weber St
- 2574 Whitmore St
- 3454 Martin Ave
- 3032 Whitmore St
- 3020 Whitmore St
- 3021 Vane St
- 3036 Whitmore St
- 3015 Vane St
- 3016 Whitmore St
- 3025 Vane St
- 3033 Whitmore St
- 3029 Whitmore St
- 3035 Whitmore St
- 3044 Whitmore St
- 3021 Whitmore St
- 3039 Whitmore St
- 3012 Whitmore St
- 3011 Vane St
- 3019 Whitmore St
- 3043 Whitmore St
- 3041 Vane St
- 3048 Whitmore St
- 3045 Whitmore St