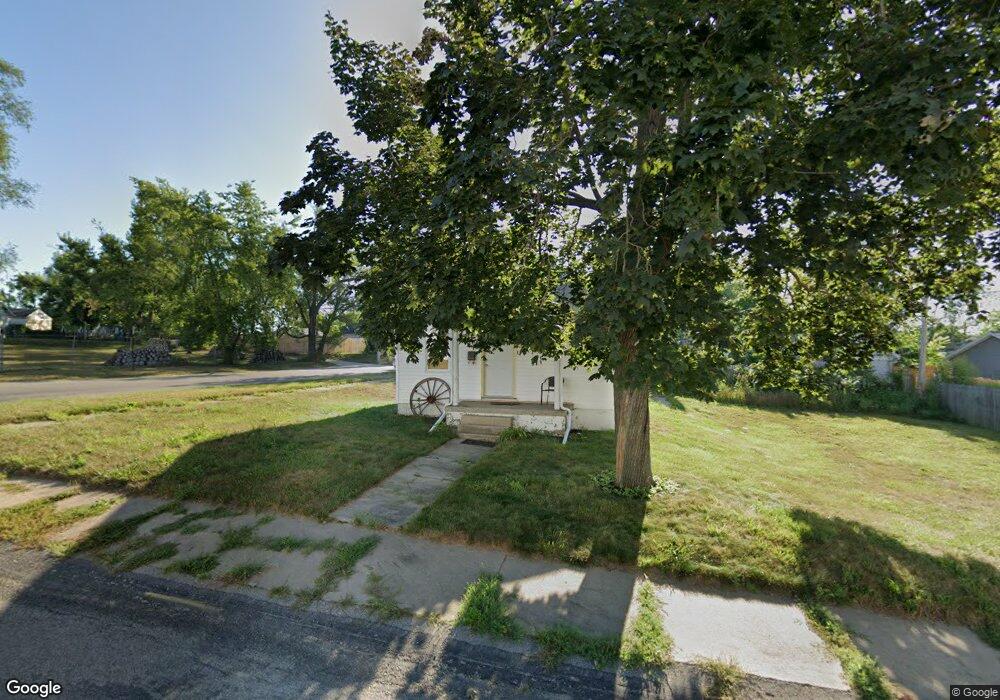
3029 2nd Ave SE Cedar Rapids, IA 52403
Kenwood Park NeighborhoodEstimated Value: $63,000 - $115,000
2
Beds
1
Bath
580
Sq Ft
$157/Sq Ft
Est. Value
About This Home
This home is located at 3029 2nd Ave SE, Cedar Rapids, IA 52403 and is currently estimated at $91,232, approximately $157 per square foot. 3029 2nd Ave SE is a home located in Linn County with nearby schools including Arthur Elementary School, Franklin Middle School, and George Washington High School.
Ownership History
Date
Name
Owned For
Owner Type
Purchase Details
Closed on
Feb 14, 2025
Sold by
Pritchett Richard
Bought by
Pritchett Steven
Current Estimated Value
Purchase Details
Closed on
Dec 15, 2014
Sold by
Martin Michael P and Martin Kelly M
Bought by
Pritchett Richard and Pritchett Marilyn
Purchase Details
Closed on
Feb 8, 2005
Sold by
Dahl James R and Dahl Danette A
Bought by
Martin Michael P and Martin Kelly M
Purchase Details
Closed on
Oct 7, 2003
Sold by
Duggan Mary D
Bought by
Dahl James R and Dahl Danette A
Home Financials for this Owner
Home Financials are based on the most recent Mortgage that was taken out on this home.
Original Mortgage
$20,000
Interest Rate
6.49%
Mortgage Type
Unknown
Create a Home Valuation Report for This Property
The Home Valuation Report is an in-depth analysis detailing your home's value as well as a comparison with similar homes in the area
Home Values in the Area
Average Home Value in this Area
Purchase History
| Date | Buyer | Sale Price | Title Company |
|---|---|---|---|
| Pritchett Steven | $52,500 | None Listed On Document | |
| Pritchett Steven | $52,500 | None Listed On Document | |
| Pritchett Richard | $55,000 | None Available | |
| Martin Michael P | $33,500 | -- | |
| Dahl James R | $24,500 | -- |
Source: Public Records
Mortgage History
| Date | Status | Borrower | Loan Amount |
|---|---|---|---|
| Previous Owner | Dahl James R | $20,000 |
Source: Public Records
Tax History Compared to Growth
Tax History
| Year | Tax Paid | Tax Assessment Tax Assessment Total Assessment is a certain percentage of the fair market value that is determined by local assessors to be the total taxable value of land and additions on the property. | Land | Improvement |
|---|---|---|---|---|
| 2025 | $996 | $66,200 | $20,200 | $46,000 |
| 2024 | $1,064 | $66,800 | $20,200 | $46,600 |
| 2023 | $1,064 | $66,800 | $20,200 | $46,600 |
| 2022 | $920 | $59,300 | $18,000 | $41,300 |
| 2021 | $880 | $53,400 | $15,700 | $37,700 |
| 2020 | $880 | $48,500 | $10,300 | $38,200 |
| 2019 | $798 | $45,500 | $9,000 | $36,500 |
| 2018 | $712 | $45,500 | $9,000 | $36,500 |
| 2017 | $990 | $45,500 | $9,000 | $36,500 |
| 2016 | $992 | $46,700 | $9,000 | $37,700 |
| 2015 | $878 | $41,296 | $8,986 | $32,310 |
| 2014 | $878 | $40,327 | $8,986 | $31,341 |
| 2013 | $840 | $40,327 | $8,986 | $31,341 |
Source: Public Records
Map
Nearby Homes
- 209 30th Street Dr SE
- 309 29th Street Dr SE
- 139 32nd St NE
- 3000 Carroll Dr SE
- 232 31st St NE
- 410 32nd St NE
- 3111 Carroll Dr SE
- 2523 1st Ave SE
- 419 33rd St NE
- 2522 A Ave NE
- 3322 C Ave NE
- 3140 Carroll Dr SE
- 626 Augusta Dr SE
- 413 34th St NE
- 3107 E Ave NE
- 521 29th St NE
- 2424 A Ave NE
- 127 24th Street Dr SE
- 2407 C Ave NE
- 2321 1st Ave SE
- 3015 2nd Ave SE
- 211 31st Street Dr SE
- 219 31st Street Dr SE
- 208 30th Street Dr SE
- 202 30th Street Dr SE
- 223 31st Street Dr SE
- 212 30th Street Dr SE
- 225 31st Street Dr SE
- 308 30th Street Dr SE
- 227 31st Street Dr SE
- 3119 Grove Ct SE
- 224 31st Street Dr SE
- 3121 Grove Ct SE
- 231 31st Street Dr SE
- 314 30th Street Dr SE
- 318 30th Street Dr SE
- 239 31st Street Dr SE
- 3129 Grove Ct SE
- 201 30th Street Dr SE
- 232 31st Street Dr SE