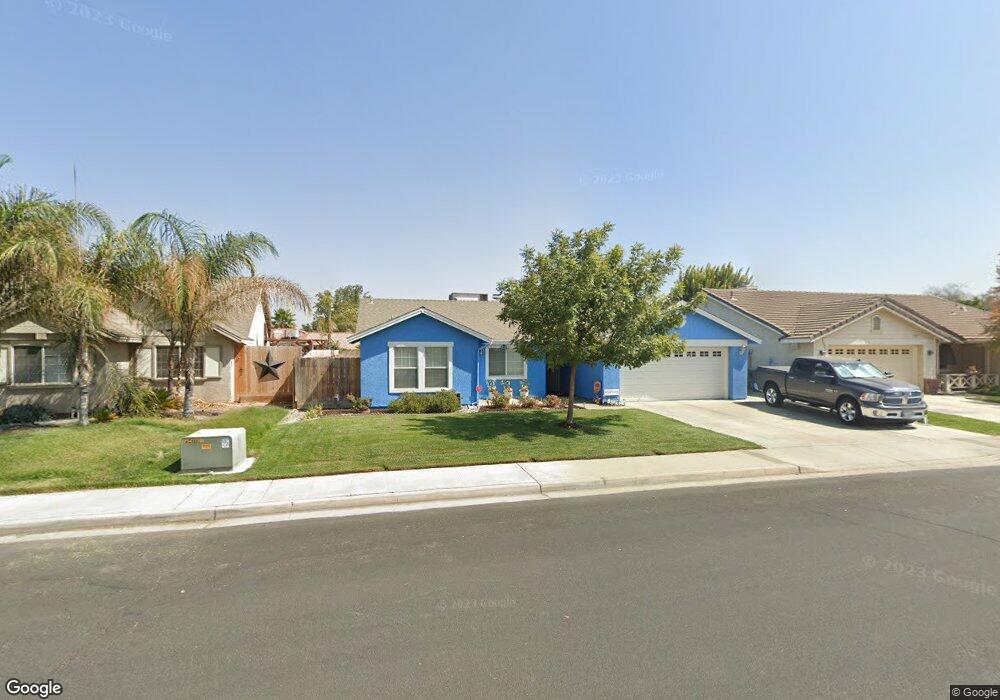
3029 Pine St Hanford, CA 93230
Estimated Value: $383,093 - $407,000
4
Beds
2
Baths
1,597
Sq Ft
$250/Sq Ft
Est. Value
About This Home
This home is located at 3029 Pine St, Hanford, CA 93230 and is currently estimated at $398,523, approximately $249 per square foot. 3029 Pine St is a home located in Kings County with nearby schools including Hanford West High School, Pioneer Elementary School, and Pioneer Middle School.
Ownership History
Date
Name
Owned For
Owner Type
Purchase Details
Closed on
Aug 28, 2017
Sold by
Weaver Vernon Michael and Weaver Marilyn L
Bought by
Weaver Vernon Michael and Weaver Marilyn L
Current Estimated Value
Purchase Details
Closed on
Nov 13, 2013
Sold by
Weaver Cameron and Weaver Ellen
Bought by
Weaver Michael Vernon and Weaver Marilyn
Purchase Details
Closed on
Oct 14, 1999
Sold by
Quail Run Hanford L P
Bought by
Weaver Cameron and Weaver Ellen
Home Financials for this Owner
Home Financials are based on the most recent Mortgage that was taken out on this home.
Original Mortgage
$105,787
Interest Rate
7.95%
Mortgage Type
FHA
Create a Home Valuation Report for This Property
The Home Valuation Report is an in-depth analysis detailing your home's value as well as a comparison with similar homes in the area
Home Values in the Area
Average Home Value in this Area
Purchase History
| Date | Buyer | Sale Price | Title Company |
|---|---|---|---|
| Weaver Vernon Michael | -- | None Available | |
| Weaver Michael Vernon | $205,000 | Chicago Title Company | |
| Weaver Cameron | $106,000 | First American Title Co |
Source: Public Records
Mortgage History
| Date | Status | Borrower | Loan Amount |
|---|---|---|---|
| Previous Owner | Weaver Cameron | $105,787 |
Source: Public Records
Tax History
| Year | Tax Paid | Tax Assessment Tax Assessment Total Assessment is a certain percentage of the fair market value that is determined by local assessors to be the total taxable value of land and additions on the property. | Land | Improvement |
|---|---|---|---|---|
| 2025 | $2,686 | $251,299 | $73,552 | $177,747 |
| 2023 | $2,686 | $241,543 | $70,697 | $170,846 |
| 2022 | $2,601 | $236,808 | $69,311 | $167,497 |
| 2021 | $2,554 | $232,165 | $67,952 | $164,213 |
| 2020 | $2,560 | $229,784 | $67,255 | $162,529 |
| 2019 | $2,518 | $225,278 | $65,936 | $159,342 |
| 2018 | $2,503 | $220,861 | $64,643 | $156,218 |
| 2017 | $2,459 | $216,530 | $63,375 | $153,155 |
| 2016 | $2,328 | $212,284 | $62,132 | $150,152 |
| 2015 | $2,257 | $209,096 | $61,199 | $147,897 |
| 2014 | $2,350 | $205,000 | $60,000 | $145,000 |
Source: Public Records
Map
Nearby Homes
- 3026 Sage Ct
- 3178 Hickory Ct
- 2710 Aspen St
- 3207 Juniper Ct
- 259 E Sherwood Dr
- 388 Timberline Ct
- 297 W Harold Griswold Way
- 903 W Sandstone Ct Unit 1
- 0 Flint Ave
- 3232 N Zion Cir
- 230 W Ash Ave
- 990 Northstar Dr
- 903 W Redwood St
- 3064 N Yale Way
- 3262 Morning Dove Ln
- 180 W Magnolia Ave
- 2335 N Douty St
- 120 W Magnolia Ave
- 165 W Magnolia Ave
- 921 Don Medico Dr
Your Personal Tour Guide
Ask me questions while you tour the home.