Estimated Value: $174,239 - $206,000
--
Bed
1
Bath
1,355
Sq Ft
$142/Sq Ft
Est. Value
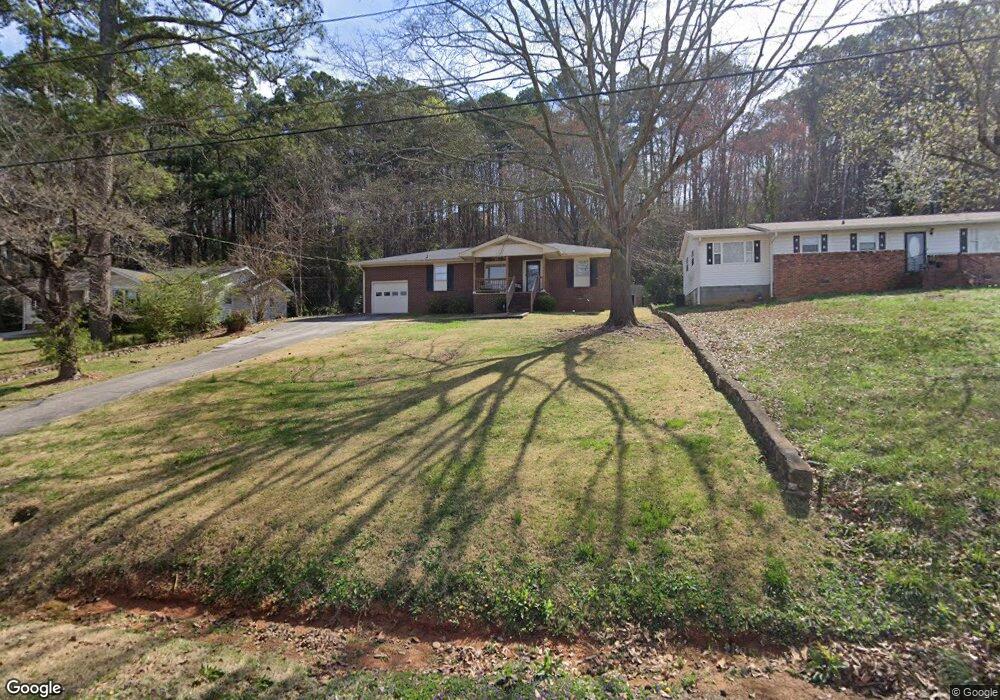
About This Home
This home is located at 303 Alfred Ave SE, Rome, GA 30161 and is currently estimated at $192,310, approximately $141 per square foot. 303 Alfred Ave SE is a home located in Floyd County with nearby schools including Pepperell Middle School, Pepperell High School, and Montessori School of Rome.
Ownership History
Date
Name
Owned For
Owner Type
Purchase Details
Closed on
Sep 24, 1999
Sold by
Secretary Of Housing And Urban Developme
Bought by
Brookshire Candice
Current Estimated Value
Purchase Details
Closed on
Apr 6, 1999
Sold by
Norwest Mortgage Inc
Bought by
Secretary Of Housing And Urban Developme
Purchase Details
Closed on
Jun 30, 1998
Sold by
Brumbelow Amanda L and Brumbelow Forrest B
Bought by
Busby Michael W and Busby Leigh G
Purchase Details
Closed on
May 13, 1998
Sold by
Howell Larry F and Howell Nancy R
Bought by
Brumbelow Amanda L and Brum Forrest B
Purchase Details
Closed on
Feb 23, 1973
Sold by
Coffia Robert H and Coffia Claudette
Bought by
Howell Larry F and Howell Nancy R
Purchase Details
Closed on
Feb 18, 1965
Sold by
Clyde Davis Bldrs Inc
Bought by
Coffia Robert H and Coffia Claudette
Purchase Details
Closed on
Sep 1, 1961
Bought by
Clyde Davis Bldrs Inc
Create a Home Valuation Report for This Property
The Home Valuation Report is an in-depth analysis detailing your home's value as well as a comparison with similar homes in the area
Home Values in the Area
Average Home Value in this Area
Purchase History
| Date | Buyer | Sale Price | Title Company |
|---|---|---|---|
| Brookshire Candice | $73,000 | -- | |
| Secretary Of Housing And Urban Developme | $81,400 | -- | |
| Norwest Mortgage Inc | $81,400 | -- | |
| Busby Michael W | $76,900 | -- | |
| Brumbelow Amanda L | -- | -- | |
| Howell Larry F | $22,200 | -- | |
| Coffia Robert H | $1,100 | -- | |
| Clyde Davis Bldrs Inc | -- | -- |
Source: Public Records
Tax History Compared to Growth
Tax History
| Year | Tax Paid | Tax Assessment Tax Assessment Total Assessment is a certain percentage of the fair market value that is determined by local assessors to be the total taxable value of land and additions on the property. | Land | Improvement |
|---|---|---|---|---|
| 2024 | $1,370 | $64,942 | $7,181 | $57,761 |
| 2023 | $1,352 | $61,882 | $6,528 | $55,354 |
| 2022 | $1,112 | $46,726 | $5,222 | $41,504 |
| 2021 | $1,002 | $39,832 | $5,222 | $34,610 |
| 2020 | $923 | $35,289 | $3,917 | $31,372 |
| 2019 | $835 | $31,097 | $3,917 | $27,180 |
| 2018 | $801 | $29,292 | $3,917 | $25,375 |
| 2017 | $784 | $28,246 | $3,917 | $24,329 |
| 2016 | $827 | $30,020 | $3,880 | $26,140 |
| 2015 | $813 | $30,020 | $3,880 | $26,140 |
| 2014 | $813 | $30,020 | $3,880 | $26,140 |
Source: Public Records
Map
Nearby Homes
- 2812 Maple Rd SE
- 327 Flora Ave SE
- 2710 Maple Rd SE
- 212 Alfred Ave SE
- 333 Alfred Ave SE
- 211 Alfred Ave SE
- 409 Flora Ave SE
- 36 Saddle Mountain Rd SE
- 2523 Maple Rd SE
- 3014 Maple Rd SE
- 2508 Maple Rd SE
- 2501 Maple Rd SE
- 107 E Linden St SE
- 3 Belmont Ct SE
- 15 Saddlebrook Dr SE
- 0 Martha Berry Hwy Unit 7525627
- 0 Martha Berry Hwy Unit 7614774
- 0 Martha Berry Hwy Unit 10563404
- 211 Chateau Dr SE
- 109 Chateau Dr SE
- 301 Alfred Ave SE
- 305 Alfred Ave SE
- 307 Alfred Ave SE
- 0 Alfred Ave SE Unit 7526772
- 0 Alfred Ave SE Unit 7088726
- 0 Alfred Ave SE Unit 7032563
- 0 Alfred Ave SE Unit 3175451
- 0 Alfred Ave SE Unit 3112021
- 0 Alfred Ave SE Unit LT 13 7388589
- 0 Alfred Ave SE Unit LT 13 7228669
- 0 Alfred Ave SE Unit 3053501
- 302 Alfred Ave SE
- 304 Alfred Ave SE
- 300 Alfred Ave SE
- 309 Alfred Ave SE
- 239 Alfred Ave SE
- 239 Alfred Ave SE Unit 20
- 306 Alfred Ave SE
- 311 Alfred Ave SE
- 308 Alfred Ave SE