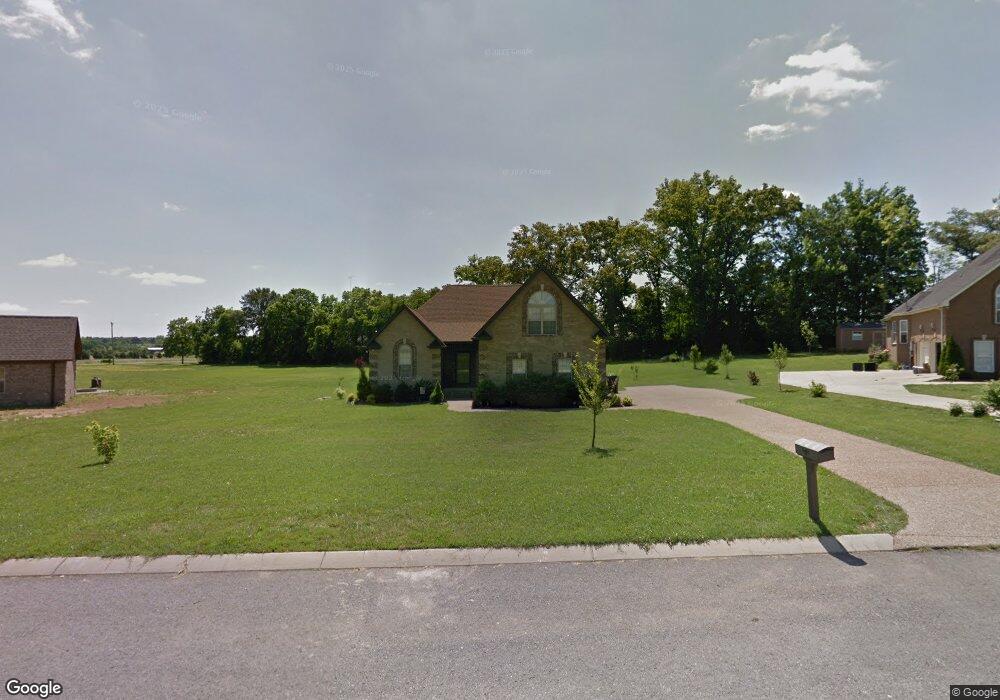
303 Branchside Dr Lebanon, TN 37087
Estimated Value: $482,741 - $576,000
--
Bed
3
Baths
2,022
Sq Ft
$268/Sq Ft
Est. Value
About This Home
This home is located at 303 Branchside Dr, Lebanon, TN 37087 and is currently estimated at $541,185, approximately $267 per square foot. 303 Branchside Dr is a home located in Wilson County with nearby schools including West Elementary School, West Wilson Middle School, and Mt. Juliet High School.
Ownership History
Date
Name
Owned For
Owner Type
Purchase Details
Closed on
Aug 31, 2021
Sold by
Barnes Marsha J
Bought by
Barnes Marsha J and Barnes Thomas W
Current Estimated Value
Home Financials for this Owner
Home Financials are based on the most recent Mortgage that was taken out on this home.
Original Mortgage
$329,000
Outstanding Balance
$299,366
Interest Rate
2.8%
Mortgage Type
New Conventional
Estimated Equity
$241,819
Purchase Details
Closed on
Sep 30, 2010
Sold by
Stacey Construction Inc
Bought by
Barnes Marsha J
Home Financials for this Owner
Home Financials are based on the most recent Mortgage that was taken out on this home.
Original Mortgage
$198,360
Interest Rate
4.25%
Mortgage Type
FHA
Purchase Details
Closed on
Jun 17, 2010
Sold by
Thomas George L
Bought by
Stacey Construction Inc
Home Financials for this Owner
Home Financials are based on the most recent Mortgage that was taken out on this home.
Original Mortgage
$155,900
Interest Rate
4.87%
Mortgage Type
FHA
Create a Home Valuation Report for This Property
The Home Valuation Report is an in-depth analysis detailing your home's value as well as a comparison with similar homes in the area
Home Values in the Area
Average Home Value in this Area
Purchase History
| Date | Buyer | Sale Price | Title Company |
|---|---|---|---|
| Barnes Marsha J | -- | Birthright Title Llc | |
| Barnes Marsha J | $205,555 | -- | |
| Stacey Construction Inc | $40,000 | -- |
Source: Public Records
Mortgage History
| Date | Status | Borrower | Loan Amount |
|---|---|---|---|
| Open | Barnes Marsha J | $329,000 | |
| Closed | Stacey Construction Inc | $198,360 | |
| Previous Owner | Stacey Construction Inc | $155,900 |
Source: Public Records
Tax History Compared to Growth
Tax History
| Year | Tax Paid | Tax Assessment Tax Assessment Total Assessment is a certain percentage of the fair market value that is determined by local assessors to be the total taxable value of land and additions on the property. | Land | Improvement |
|---|---|---|---|---|
| 2024 | $1,525 | $79,875 | $13,750 | $66,125 |
| 2022 | $1,525 | $79,875 | $13,750 | $66,125 |
| 2021 | $1,484 | $79,875 | $13,750 | $66,125 |
| 2020 | $1,710 | $77,750 | $13,750 | $64,000 |
| 2019 | $1,710 | $67,875 | $13,125 | $54,750 |
| 2018 | $1,710 | $67,875 | $13,125 | $54,750 |
| 2017 | $1,710 | $67,875 | $13,125 | $54,750 |
| 2016 | $1,710 | $67,875 | $13,125 | $54,750 |
| 2015 | $1,745 | $67,875 | $13,125 | $54,750 |
| 2014 | $1,360 | $52,891 | $0 | $0 |
Source: Public Records
Map
Nearby Homes
- 1005 Chateau Dr
- 807 Ridgestone Place
- 811 Ridgestone Place
- 1100 Wildflower Point
- 507 Lena Way
- 1207 Janie Sue Ct
- 1307 Christina Ct
- 1018 C P Stewart Blvd
- 1465 Smith Rd
- 1021 C P Stewart Blvd
- 2836 Academy Rd
- 1036 C P Stewart Blvd
- 290 Academy Rd
- 430 Northern Rd
- 2910 Cairo Bend Rd
- 817 Burton Point Rd
- 3182 Cairo Bend Rd
- 3018 Lillard Place
- 2108 Houston Bend
- 222 Ridgewater Way
- 305 Branchside Dr
- 105 Autumn Creek
- 87 Autumn Creek Dr #87-C
- 87 Autumn Creek Dr #87
- 63 Springhouse Circle #63
- 63 Springhouse Cir Unit 63
- 77 Autumn Creek Dr #77
- 77 Autumn Creek Unit 77
- 103 Autumn Creek
- 67 Springhouse Circle #67
- 67 Springhouse Cir Unit 67
- 307 Branchside Dr
- 84 Autumn Creek Dr #84
- 84 Autumn Creek
- 84 Autumn Creek Unit 84
- 78 Autumn Creek Dr #78
- 107 Autumn Creek
- 61 Springhouse Circle #61-C
- 61 Springhouse Cir Unit 61-C
- 304 Branchside Dr