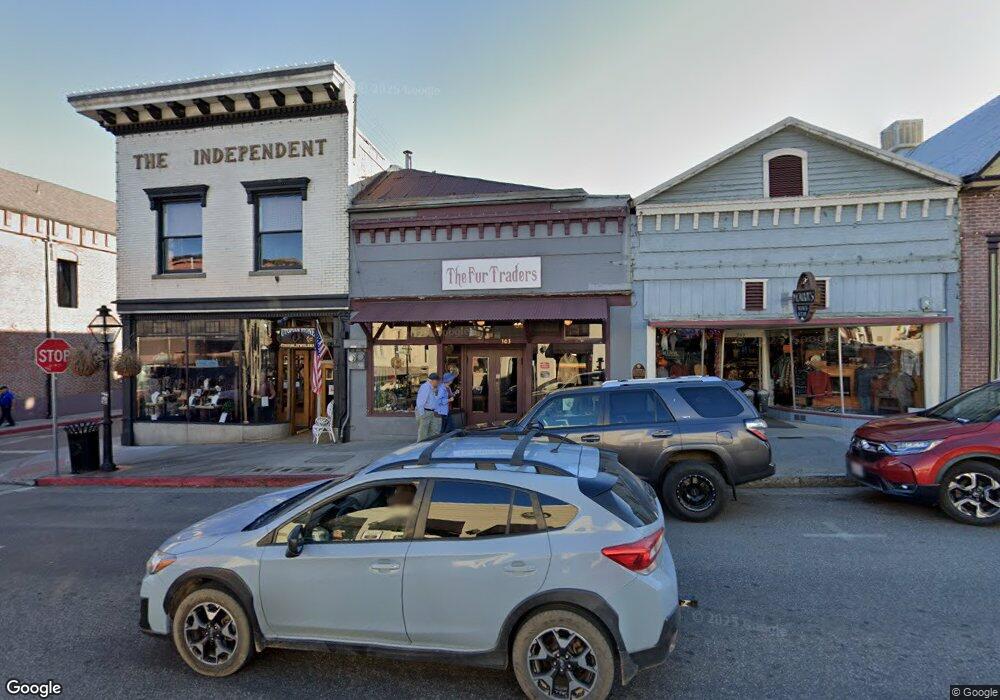
303 Broad St Nevada City, CA 95959
Estimated Value: $507,601
Studio
--
Bath
1,901
Sq Ft
$267/Sq Ft
Est. Value
About This Home
This home is located at 303 Broad St, Nevada City, CA 95959 and is currently estimated at $507,601, approximately $267 per square foot. 303 Broad St is a home located in Nevada County with nearby schools including Deer Creek Elementary School, Seven Hills Intermediate School, and Forest Charter School.
Ownership History
Date
Name
Owned For
Owner Type
Purchase Details
Closed on
Apr 5, 2019
Sold by
Murphy Gail I and Gail I Murphy Revocable Trust
Bought by
Costello Barry and Costello Marjorie
Current Estimated Value
Home Financials for this Owner
Home Financials are based on the most recent Mortgage that was taken out on this home.
Original Mortgage
$250,000
Outstanding Balance
$219,794
Interest Rate
4.3%
Mortgage Type
Commercial
Estimated Equity
$287,807
Purchase Details
Closed on
May 10, 2011
Sold by
Murphy Gail
Bought by
Murphy Gail I and The Gail I Murphy Revocable Tr
Create a Home Valuation Report for This Property
The Home Valuation Report is an in-depth analysis detailing your home's value as well as a comparison with similar homes in the area
Home Values in the Area
Average Home Value in this Area
Purchase History
| Date | Buyer | Sale Price | Title Company |
|---|---|---|---|
| Costello Barry | $400,000 | Placer Title Co | |
| Murphy Gail I | -- | None Available |
Source: Public Records
Mortgage History
| Date | Status | Borrower | Loan Amount |
|---|---|---|---|
| Open | Costello Barry | $250,000 |
Source: Public Records
Tax History
| Year | Tax Paid | Tax Assessment Tax Assessment Total Assessment is a certain percentage of the fair market value that is determined by local assessors to be the total taxable value of land and additions on the property. | Land | Improvement |
|---|---|---|---|---|
| 2025 | $4,716 | $446,201 | $167,325 | $278,876 |
| 2024 | $4,632 | $437,453 | $164,045 | $273,408 |
| 2023 | $4,632 | $428,877 | $160,829 | $268,048 |
| 2022 | $4,540 | $420,469 | $157,676 | $262,793 |
| 2021 | $4,438 | $412,226 | $154,585 | $257,641 |
| 2020 | $4,432 | $408,000 | $153,000 | $255,000 |
| 2019 | $5,911 | $549,200 | $152,300 | $396,900 |
| 2018 | $5,637 | $523,000 | $145,000 | $378,000 |
| 2017 | $5,462 | $506,000 | $152,000 | $354,000 |
| 2016 | $5,120 | $482,000 | $145,000 | $337,000 |
| 2015 | $4,888 | $459,000 | $138,000 | $321,000 |
| 2014 | $4,816 | $450,000 | $135,000 | $315,000 |
Source: Public Records
Map
Nearby Homes
- 224 Church St
- 233 Bridge St Unit A
- 317 S Pine St
- 203 Prospect St
- 126 Boulder St
- 327 Drummond St
- 603 W West Broad St
- 611 W Broad St
- 432 S Pine St
- 347 Nile St
- 520 Lost Hill Ct
- 509 Sacramento St
- 614 Zion St
- 521 Silva Ave
- 660 Chief Kelly Dr
- 708 W Broad St
- 362 Gracie Rd
- 16970 Old Downieville Hwy
- 10641 Boulder St
- 12056 N Bloomfield Rd
Your Personal Tour Guide
Ask me questions while you tour the home.